

Recession, Production Costs and Gold Prices
Recession, Production Costs and Gold Prices
There's more to gold than real rates and the dollar

In “The Golden Rules,” I wrote about a simple model I’ve created that relates changes in the price of gold to two key fundamentals – real interest rates and the US Dollar Index.
Like all models this one is far from perfect – not even close – but it’s generally been directionally correct about the path of gold over time.
The primary flaw is that gold prices have tended to overshoot the fundamentals at times, rising more than the model projects, and falling more than the model anticipates, in reaction to changes in rates and the US dollar.
I created this model by regressing 5-week changes in the price of gold against 5-week changes in the yield on 5-Year Treasury Inflation-Protected Securities (TIPs) and 5-week changes in the US Dollar Index. All changes are expressed in basis points where 1 basis points equals 1/100th of 1% (1 basis point = 0.01%).
I created the model using data on all three variables from 1997 through the end of 2020, so all model projections are “out of sample.”
Let’s take a quick look:
Source: Bloomberg
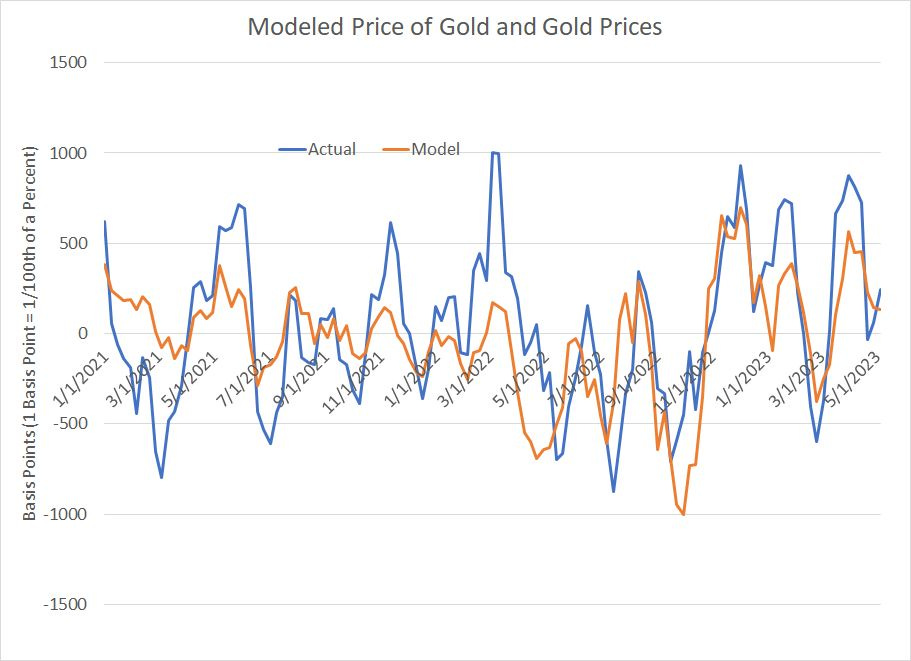
The blue line on my chart represents actual 5-week changes in gold prices while the orange line and the current model estimates how much gold “should” have rallied over the past 5 weeks.
Simply put, gold overshot on the upside slightly in late March. While the data supported higher gold prices due to declines in real rates and the US Dollar Index, the magnitude of the rally was roughly 300 basis points more than the model suggested.
Since then, as is often the case, gold prices have pulled back somewhat, more in-line with this simple model.
However it’s also crucial to understand the price of gold is about a lot more than just the dollar and real rates:
The Gold Cycle
In recent economic and market cycles, gold prices tend to rally around the start of a US recession:

Source: Bloomberg
This chart shows the change in the price of gold from the end of March 2000 through November 2002 – this is one year before the start of the US recession in March 2001 through one year after the end of recession in November 2001.
I’ve also labeled the Fed’s last hike in May 2000 and the Fed’s first cut in January 2001.
You can see that gold experienced a powerful one-year rally following the start of recession in 2001.
It’s a common fallacy that gold prices benefit from a falling stock market. In this 2000-02 cycle, for example, the stock market peaked in May 2000 and the sell-off accelerated in the fall and winter of 2000-01; however, gold prices followed the market lower initially before soaring when recession became reality. One possible reason is that when the stock market sells off quickly, the first knee-jerk reaction is to raise cash by selling any liquid assets, including gold.
A similar pattern is evident around the 2007-09 recession:
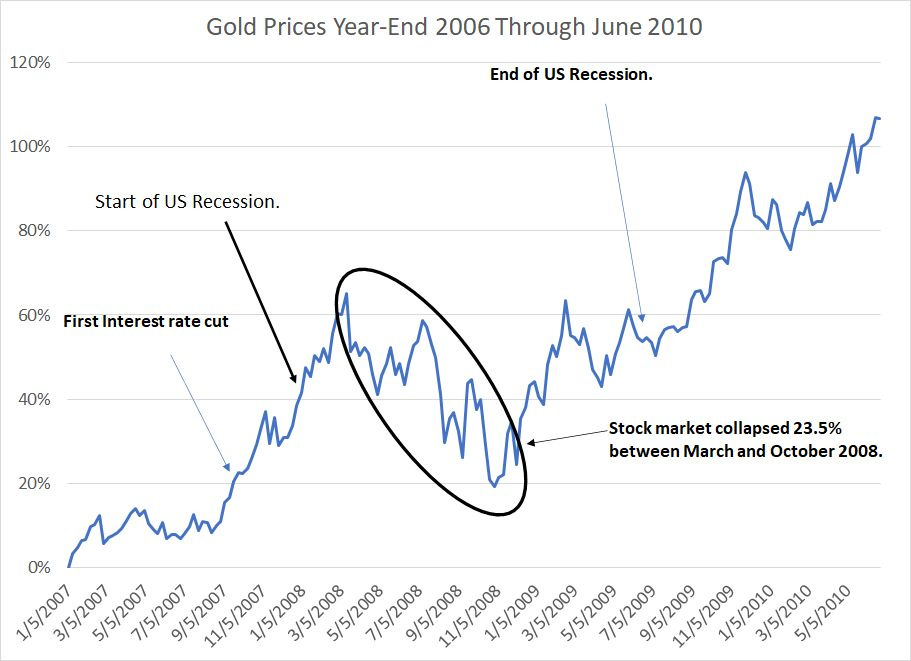
Source: Bloomberg
No two cycles are exactly alike, but they do rhyme. In the 2007-09 cycle, gold prices started to ramp higher just before the start of the US recession. Gold did see a significant correction through an intense phase of the stock market sell-off, and the collapse of financials like Lehman Brothers, between March and October 2008.
However, following that pullback, gold soared to fresh all-time highs in 2009 and 2010 and reached a major peak in the fall of 2011 over $1,900 an ounce.
One more point that’s widely overlooked:
It’s All Marginal
Commodity markets — ALL commodity markets — are built around the marginal cost of supply.
Take oil as an example. Some Saudi fields are reported to have a marginal cost of production under $10/bbl, meaning that these fields could be profitable to produce in virtually any oil price environment,.
These low-cost fields do NOT determine global oil supply. Instead, the marginal amount of oil supply in the world depends on the highest-cost fields, because these fields will only add to supply when prices are high enough to support their economic production. High-cost fields represent the “swing” suppliers.
So, if we’re assessing the 3 key fundamentals of a commodity market — supply, demand and price — it pays to understand where the marginal swing supply is and how much it costs to produce. Simply put, if the world doesn’t have enough oil, then the price will ultimately need to rise far enough above that marginal supply cost to incent its production.
And if the world has too much oil, then prices will need to fall to levels that discourage enough marginal production to balance supply and demand.
Of course, the marginal source of supply and price needed to support its production changes over time. In gold markets, like oil and natural gas, costs have generally risen sharply over the past few years:
Source: Bloomberg
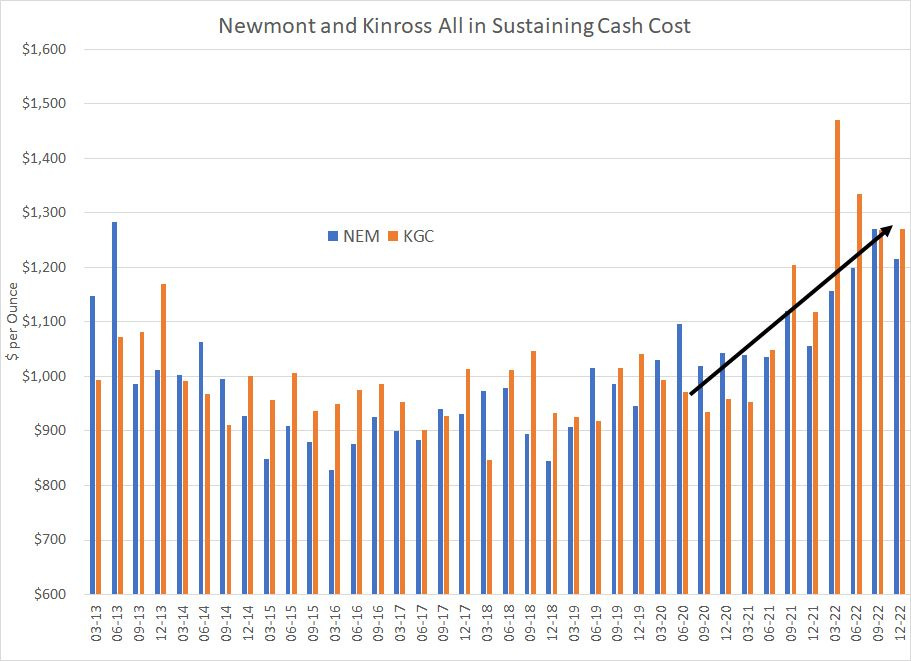
All in sustaining cash cost measures the total cost of mining an ounce of gold including “sustaining” capital spending (CAPEX) needed to maintain the mine and production, general and administrative (G&A) costs, additional exploration costs, and environmental rehabilitation costs.
Kinross Gold and Newmont are both large, senior producers and you can see costs per ounce have been rising for both companies since 2021. This should come as little surprise since cost inflation has been a persistent problem for many industry groups over the past 2 to 3 years.
And Newmont and Kinross are far from the world’s highest-cost “marginal” gold producers.
Simply put, if demand for gold rises from current levels, the price of gold will need to rise even further to incentive new supply given the higher cost curve.
DISCLAIMER: This article is not investment advice and represents the opinions of its author, Elliott Gue. The Free Market Speculator is NOT a securities broker/dealer or an investment advisor. You are responsible for your own investment decisions. All information contained in our newsletters and posts should be independently verified with the companies mentioned, and readers should always conduct their own research and due diligence and consider obtaining professional advice before making any investment decision.