

Recession Risks Rising
Recession Risks Rising
Payrolls, Unemployment and the "Sahm Rule"

Amid all the talk of a “soft landing,” economic data continues to weaken and signal elevated probability of recession ahead.
In October, the Bureau of Labor Statistics (BLS) reported the US economy added 150,000 jobs compared to the 180,000 economists had expected. In addition, BLS proceeded to revise its estimates of payrolls over the past two months lower by a whopping 101,000.
Take a look:
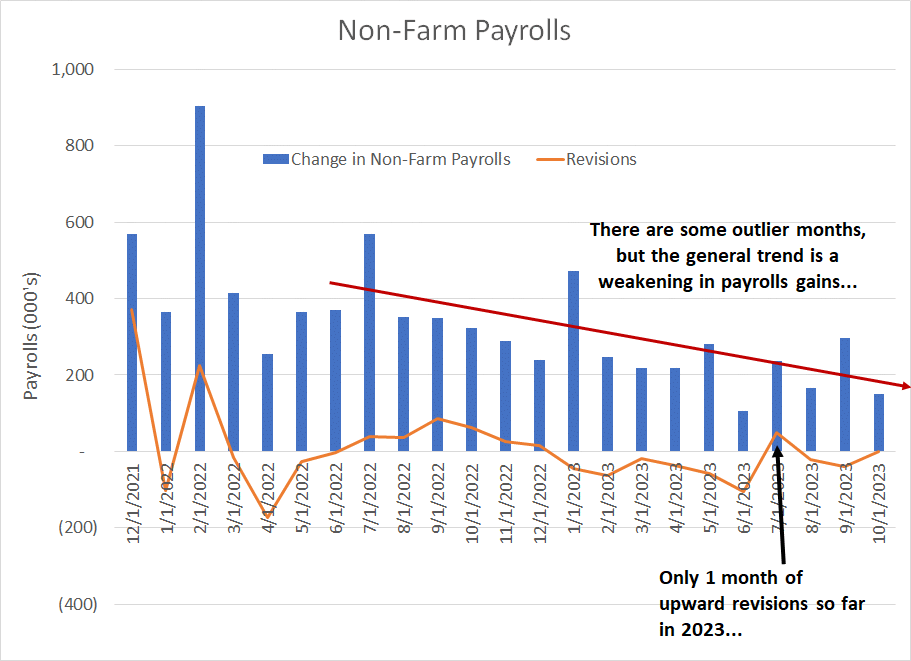
Source: Bloomberg, Bureau of Labor Statistics (BLS)
As I’ve written before in FMS, BLS payrolls data is subject to massive subsequent revisions and significant month-to-month volatility. For example, June 2023 payrolls look very weak after recent revisions while the September number, released one month ago, is still strong despite a downside revision with today’s release.
However, two points are crystal clear:
First, there’s been a gradual-but-steady downtrend in month-over-month payrolls gains since the summer of 2022, which I’ve marked with a red arrow on my chart.
Second, out of the 10 months reported so far in 2023 (Friday’s release was for October 2023) BLS has revised its initial payrolls estimates lower for 8 of those months.
Only one month was revised higher (July 2023 by 49,000 jobs) while the October number was just reported and won’t be subject to revisions until BLS releases its next Employment Situation report on Friday December 8th.
Cumulative downward revisions to payrolls so far this year total 337,000 jobs and more are likely when BLS releases its annual benchmarking in February 2024.
Clearly, the US government doesn’t count every single new job created in the country each month, so the monthly Employment Situation report is based on surveys and statistical models. Specifically, surveys of US companies and households as well as models to adjust for factors including seasonality and the “birth” and “death” of new businesses each month.
As with most models and survey-based data, the BLS jobs data tends to be most wrong – and sees the largest subsequent revision activity – at key economic turning points such as the top of a cycle. Simply put, the trend toward consistent downward revisions this year, and the general downtrend in jobs created, are exactly what I’d expect to see in the very late stages of an economic expansion or the early stages of a downturn/recession.
Of course, there’s more to it than that:
Private vs. Government Jobs
Even more worrying than the trend in overall payrolls is the trend in private payrolls:
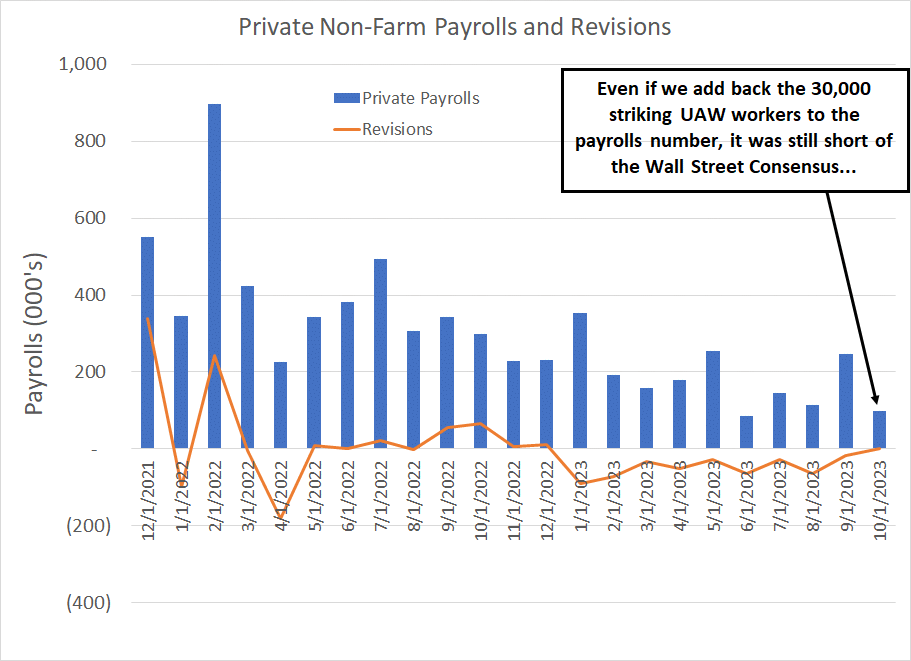
Source: Bloomberg, BLS
In October, BLS reports the US added 99,000 private payrolls, well below the Wall Street consensus outlook for +145,000. Indeed, even if we add back the roughly 30,000 payrolls impacted by the United Auto Workers (UAW) union strikes last month, private sector jobs creation was well below the consensus.
And, BLS has revised estimates for private jobs gains lower even more aggressively than for total payrolls. Indeed, revisions have been lower for every single month this year except for just-released October numbers to a cumulative total of negative 445,000 private sector jobs.
And take a look at the trends in employment at temporary help services:
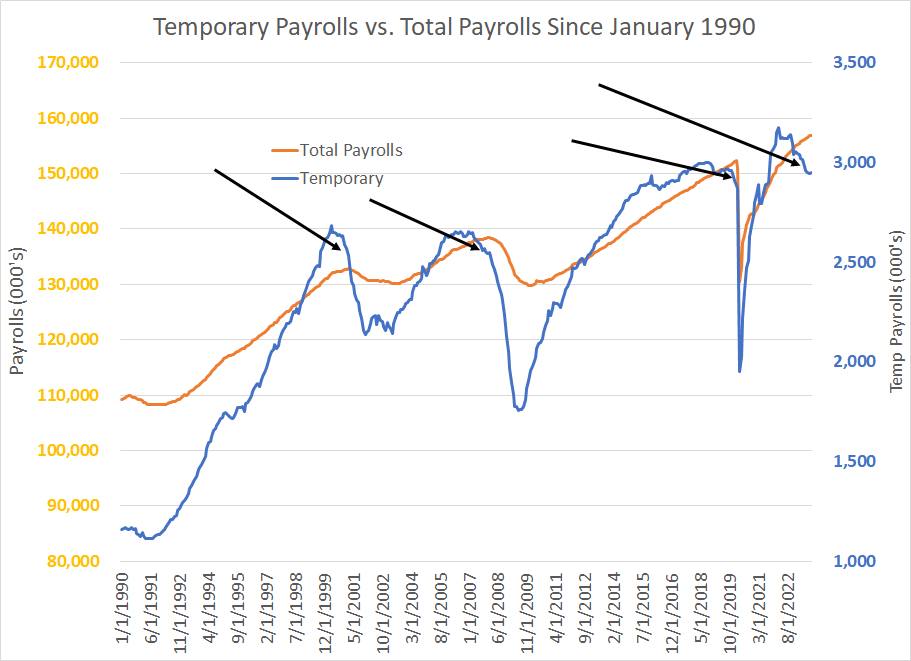
Source: Bloomberg, BLS
This chart shows total US Non-Farm Payrolls (orange line, left-hand scale) and Temporary Help Services Employment (blue line, right hand scale) since January 1990.
As you can see here, trends in temporary help services employment tend to lead changes in total non-farm payrolls. I’ve indicated with black arrows several occasions when temporary help services employment declined significantly before total US payrolls started to fall and the US economy entered recession.
This is logical.
After all, laying off full-time employees can be expensive as can hiring and training new workers. So, firms are reluctant to let go of staffing at the first sign of economic weakness, amid fear the economy will reaccelerate and they’ll need to recruit new employees.
So, one cost-cutting strategy is to let go of temporary help – such workers usually remain employees of a temporary staffing company like Robert Half (NYSE: RHI) even when contracted to do work at a company. So, it’s relatively inexpensive to release those workers from their contracts. And companies often use temp workers to handle unexpected surges in demand, so when the economy stalls, they’re able to handle more work in-house with their full-time staff.
Bottom line: Temporary help services in the US shed almost 200,000 payrolls over the past 12 months. Historically, this means we should start to see an outright decline in US payrolls within the next few months.
One more point regarding the jobs number:
The “Sahm” Rule
This indicator is named after a former Fed economist, Claudia Sahm, and it’s been making the rounds a lot lately on trading desks.
The idea is pretty simple.
When the 3-month moving average of the unemployment rate rises 0.50% or more relative to the 12-month low in unemployment the US is either in recession or will soon enter recession. This month the unemployment rate rose from 3.8% to 3.9% and the Sahm Rule is close to triggering:

Source: Bloomberg, Federal Reserve Bank of St. Louis
Right now, the Sahm indicator stands at 0.33% compared to zero as recently as April, so, we’re not quite at the 0.50% threshold just yet. However, the unemployment rate is up to 3.9% from a cycle low of 3.4% in January, so a further 0.1% rise to around 4% would likely be sufficient to trigger this indicator.
Two points to note about the Sahm rule:
As you can see in my chart above, once the rule is triggered, the unemployment rate tends to accelerate to the upside. That, of course, wouldn’t bode well for consumer spending into 2024.
The Sahm Rule is often “late,” signaling only after an NBER-defined recession is already underway. That means it’s quite plausible, especially if BLS continues to revise lower payrolls numbers, that the US is already in recession right now.
And, of course, there’s a lot more evidence of economic weakness in the US than the October employment report including last week’s much weaker-than-expected ISM Manufacturing data.
The end result: The futures market has started to price in rising probability that the Fed’s next moves will be a cut in rates rather than additional hikes:
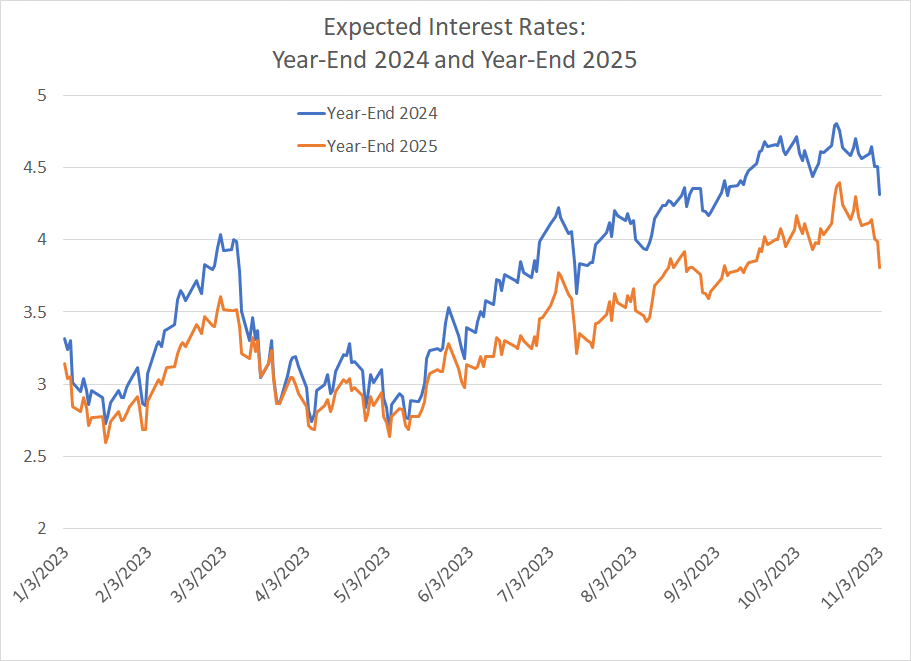
Source: Bloomberg
This chart is based on SOFR futures, showing expected short-term interest rates for December 2024 in blue and December 2025 in orange.
As you can see, as of mid-October, market participants expected short term interest rates to remain over 4.8% as of the end of next year and 4.4% by the end of 2025. Given the current Fed Funds effective rate of 5.33%, that implies the Fed would only make modest adjustments to rates over the next two years – basically “higher for longer.”
However, as of Friday afternoon, following the jobs report, SOFR futures had shaved an additional 50 basis points from expected end-2024 rates, down to 4.3%, implying around 100 basis points of cuts through next year. And by the end of 2025 the market is expecting around 150 basis points in total cuts from the current level.
You can clearly see the uptrend in rate expectations since May that’s finally been broken over the past few days.
Further, the Fed Funds futures market currently pegs the probability of an additional 25 basis point hike from the Fed at a paltry 11%; the same market sees a 77% chance the Fed cuts at least once from the current level by the time of its May 1, 2024 meeting and it has fully priced in 50 basis points of cuts by the Fed’s July 31, 2024 meeting.
Why would the Fed slash rates by 100 basis points over the next year?
There’s really only one answer that makes sense -- further signs of economic weakness and rising risk of recession.
Listen, it seems that many pundits and talking heads in the mainstream media view the Fed as some sort of wizard, a powerful benevolent force that will step in and intervene to support the market and economy at the first sign of trouble.
However, what should worry you isn’t how the Fed adjusts rates higher or lower by 25 basis points in a normal economic environment, it’s what happens when the central bank loses control of the situation.
Just remember, in 2001-02 and 2007-09 the Fed did act to cut rates and ease monetary policy; yet the economy still slipped into recession, and the stock market experienced a major decline.
I’ve said it before in this service, but it bears repeating:
When the Fed does start cutting rates it will be bearish, NOT bullish for the S&P 500.
Indeed, I still expect the October 2022 lows to eventually be broken to the downside, likely by a significant margin, given just how overvalued the market is today relative tom long-term historical norms.
A Year-End Rally?
Over the past two weeks in this column, I’ve explained how the broader market, and key sectors like Consumer Discretionary and Technology, were close to breaking major technical support on the charts. I also wrote that with the broader stock market deeply oversold just as we enter the strongest period of the year on a seasonal basis, I was reluctant to get too aggressive on the bear side.
In my view the broader S&P 500 held where it had to hold last week after spending a total of just 6 consecutive trading days below the 200-day moving average. In addition, the oversold signal on the Relative Strength Index (RSI) I wrote about in last week’s issue “worked” once again.
I took a quick look at seasonals for the final two months of each calendar year since 1970 – In November-December, the S&P 500 has rallied an average of 3.52% in all years since 1970 and it’s up 77.4% of the time.
In total, the S&P 500 has fallen in the month of October in 20 years since 1970. However, following October weakness, the S&P 500 produced a positive return in the final two months of the year 80% of the time for an average return in all years of 4.05%.
So, a short-term rally remains the most likely outcome even as clear cracks form in the soft landing thesis set us up for a troubled ‘24.
DISCLAIMER: This article is not investment advice and represents the opinions of its author, Elliott Gue. The Free Market Speculator is NOT a securities broker/dealer or an investment advisor. You are responsible for your own investment decisions. All information contained in our newsletters and posts should be independently verified with the companies mentioned, and readers should always conduct their own research and due diligence and consider obtaining professional advice before making any investment decision.