

Remain Situationally Aware
Remain Situationally Aware
Trend is up, but risks are building

Over the July 4th holiday last week, I decided to go for a paddle on the river near my home.
There was a ton of boat traffic, and, in my experience, holidays tend to bring out the inexperienced “captains” in droves. So, I headed for the upper reaches of the river where it’s often just 10 to 15 feet wide, covered with a thick canopy of trees, and you rarely see a soul.
I was quietly fishing, enjoying the scenery and silence, when I happened to notice a roughly 10-foot alligator slide into the water less than 30 feet ahead of me. Now, gators are common in my area of Florida and they’re not usually aggressive; I’d already seen a half dozen on my paddle, all quite small.
However, I can’t imagine it would have been a great idea to paddle a kayak right by, or over, a gator that size on a narrow river while fishing for said gator’s primary source of food. I can also imagine it would have been pretty easy to paddle right by that alligator without even knowing he was there – even the large ones are extraordinarily quiet.
One must remain situationally aware.
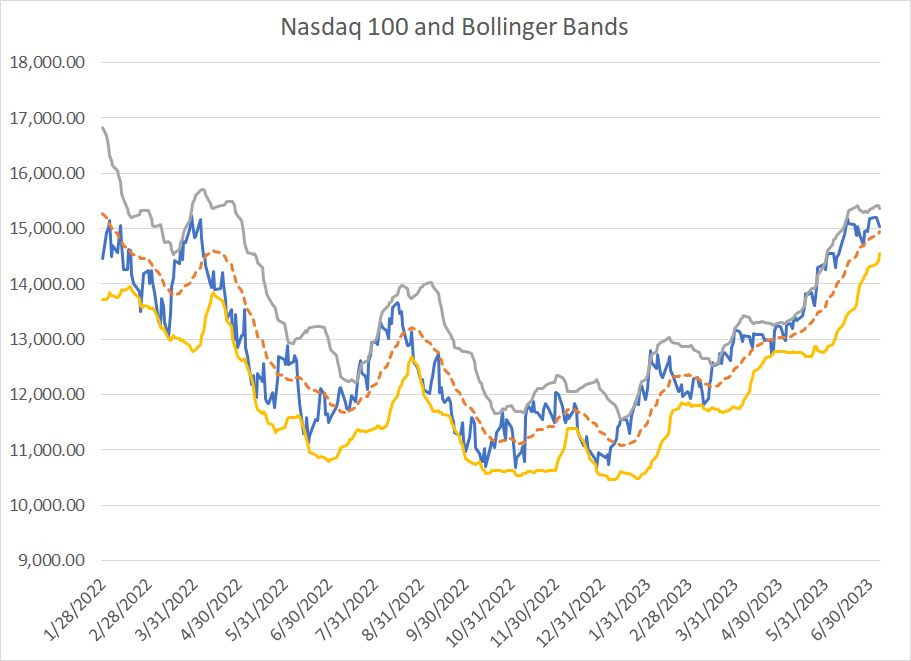
That’s a pretty good analogy for what’s happening in the US stock market right now. There’s no denying the technical strength, particularly for the Nasdaq:
Source: Bloomberg
This chart shows the Nasdaq 100 since early last year overlaid with Bollinger Bands.
Bollinger Bands are a technical indicator named after their inventor, John Bollinger. The middle band (dotted orange line) is simply the 20-day moving average for the index; the upper and lower bands are set 2 standard deviations above and below that middle band respectively.
Most of the time, a stock or index will remain between the two bands and, if you look closely at my chart above, you’ll see the Nasdaq 100 often seemed to find support near the middle and lower bands or encountered resistance near the upper band.
When a stock or index is strong, it’ll spend most of the time in the upper half, between the middle and upper bands. And very strong stocks or indices will “walk the bands” higher, closing repeatedly above the upper band while jumping through many obvious resistance levels on the charts.
Such is the case with the Nasdaq 100. As you can see, the index hasn’t tested the lower band since late April and from mid-May through mid-June, the Nasdaq “walked” the bands higher on its way to retesting its late March 2022 highs.
Further, the Nasdaq Composite’s return in the first half of 2023 is little short of extraordinary:

Source: Bloomberg
The Nasdaq Composite saw a total return, including dividends, of 32.32% in the first half of 2023, a gain bested only by two first-half years – 1975 and 1983 – in the past 51.
It’s pretty hard to argue with that strength and it’s quite possible – even likely – the upside momentum could continue for some time.
In my experience, technicals and momentum dominate the market in the short to intermediate-term; however, macroeconomic, and fundamental considerations eventually will out. In this case, I believe there remain serious risks lurking just beneath the surface that continue to be widely ignored.
Let’s start with this:
Sentiment Turning Bullish
I’ve written about investor sentiment on a few occasions in The Free Market Speculator including the June 14th issue “The Pain Trade,” and the August 18, 2022 issue “It’s All About Positioning.”
The concept is pretty simple – when most investors are bullish that leaves little cash on the sidelines to commit to stocks and drive the market higher. Therefore, the probability of a sell-off is high.
The opposite is true when most investors are leaning bearish.
The problem is measuring sentiment. There really is no perfect indicator that tracks the collective expectations of stock market investors; meanwhile, changes in market dynamics in recent years have rendered certain indicators, like the Commitment of Traders report less conclusive for the S&P 500, though still useful.
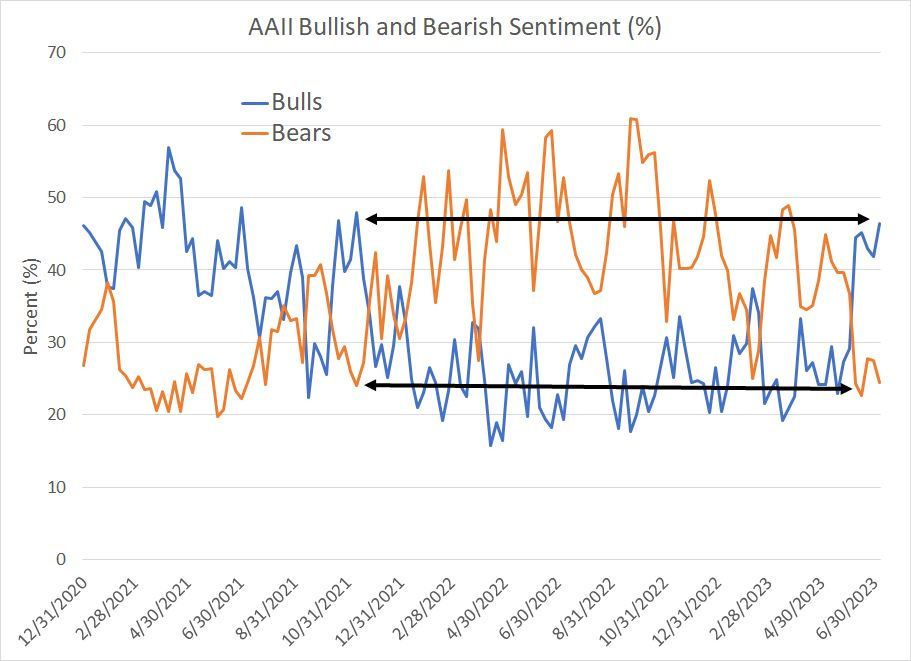
However, the latest results of the American Association of Individual Investors (AAII) weekly survey caught my eye:
Source: American Association of Individual Investors (AAII), Bloomberg
In last week’s survey 46.4% of respondents were bulls and just 24.5% reported being bearish on the stock market.
Granted, this series is noisy, but if you look at my chart above, you can see bullish sentiment hasn’t been this pervasive since October 2021, just ahead of the peak for the Nasdaq and a few months before the January 2023 bull market peak for the S&P 500. Similarly, bears haven’t been this endangered since roughly October-November 2021.
Of course, it can take time for these contrarian sentiment trades to prove out – as you can see in my chart above, there were few bears and plenty of bulls in the spring of 2021 as well. Yet, despite that bullish sentiment, the market continued to rally for an additional 6 to 9 months, depending on whether you watch the Nasdaq or the S&P 500, before finally topping out.
Late last year in this very column I noted growing bearish sentiment raised the probability of at least a short-term rally in the broader market.
Sentiment began to turn negative by the end of August 2022; yet, the broader market continued its descent into October, and the Nasdaq remained weak through the end of 2022. The rally that’s ensued is far more powerful and durable than I’d anticipated; however, the basic contrarian concept of buying pessimism and selling optimism proved out.
Looking at the chart above I can’t help but wonder if signs the bears are finally capitulating, and embracing the upside momentum, could mark the beginning of the end of the recent advance.
At a minimum, bearish sentiment has dissipated to the point the market is more prone to disappointment in the form of weak economic data, hawkish inflation data or even a series of less-than-spectacular earnings releases as Q2 2023 earnings season kicks off later this week.
In short, bullish sentiment doesn’t mean the market has peaked, but it’s enough to have me on high alert for potential danger or trouble ahead.
And then there’s this:
How About Those Jobs
Long-time readers know I’m not a huge fan of the monthly Employment Report released by the US Bureau of Labor Statistics (BLS).
While this release is arguably the most widely watched economic report in the world, it suffers from two key defects.
First, there are more than 330 million people living in the US and the size of the labor force tops 160 million employed at companies of all shapes and sizes. The employment report was released on July 7th, covering the month of June 2023; it’s impossible to have an accurate count of changes in the number of employed and unemployed workers for the month mere days after it ended.
As you might expect, BLS uses a wide range of sampling techniques and models to estimate changes in US employment each month. Certainly, there’s nothing wrong with using statistical sampling techniques to monitor economic conditions, but such estimates are subject to a margin of error.
For example, last week BLS reported the US added a total of 209,000 jobs in June with private sector jobs up 149,000. In the very same report, however, BLS reported the 90% confidence interval on these estimates is plus or minus 130,000 payrolls.
Thus, what BLS really reported last week is the government has roughly 90% confidence the US added somewhere between 79,000 and 339,000 jobs in the month of June.
Of course, market participants tend to treat the headline number as a precise, exact point estimate rather than a likely range of possibilities, and react accordingly.
If BLS had told us the economy created 80,000 jobs last month I suspect you’d have been reading headlines about imminent recession, and if they’d told us the US created 330,000 jobs, we’d be treated to stories about the economic boom underway and the need for the Fed to hike rates to 6% to quell inflation.
Regardless, both +80,000 and +330,000 are within that 90% confidence interval.
We also know payrolls are a lagging economic indicator and the scale of revisions to the data tends to increase near, or contemporaneous with, major changes in the economic cycle. Subsequent revisions to monthly data can completely change the interpretation.
In that regard, not only did the headline payrolls number come in a bit below expectations this month but the month-over-month change in private payrolls was the lowest since December 2020. On top of that, the government revised the last two months’ jobs creation numbers lower by a combined 110,000 payrolls.
Another point caught my eye:
Source: Bloomberg
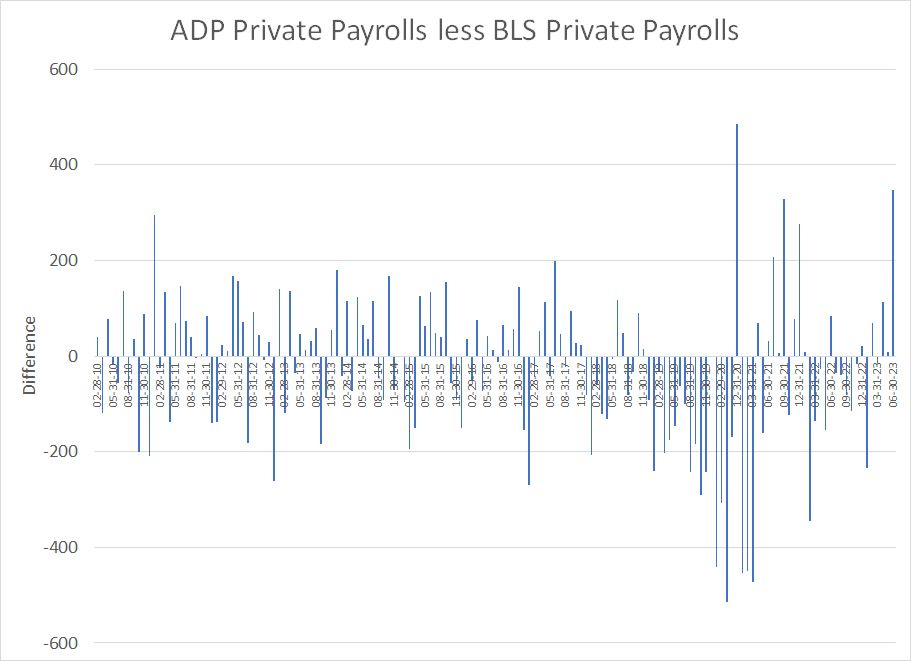
Each month, payroll processing giant ADP releases its own estimate of US private sector jobs growth, usually two days before the BLS report. Truth be told, the ADP data is often maligned and the BLS data series has a more profound market impact.
However, equity markets tend to sit up and take notice when there’s a huge gap in the message between ADP and BLS. And, last week, ADP reported a blistering private sector gain of 497,000 jobs in the month of June, well above consensus expectations for a reading of +225,000 jobs on the ADP survey. As I explained earlier, the BLS report in contrast came in light with 149,000 private payrolls versus the 200,000 expected.
My chart above shows the difference between the ADP and BLS estimates each month since early 2010, excluding the period from March to September 2020 when COVID-era distortions caused wild wings in both series. What you can see here is the difference between the two series is the second largest in history, lagging only (COVID lockdown-impacted) December 2020.
So, who’s right, ADP or the government?
Truth be told, I don’t know, but I do know someone is off, way wide of the mark of reality.
More importantly, since both ADP and BLS use statistical models to monitor and sample US employment trends, the wide variation in those estimates strongly suggests there’s something “weird” going on with these models.
When a statistical model spits out questionable results it’s usually not a great idea to just accept those results as fact – at a minimum, you should take the incoming data with a grain of salt.
My guess, hopefully an educated one, is the deviation between these two series suggests that one or both models will see some larger-than-normal revisions in coming months. While I don’t know which way those will break – showing a stronger or weaker labor market – we do know that both BLS and ADP tend to overestimate employment near the peak of a cycle, leading to large subsequent revisions.
Just as the jobs number hit last week, I also noticed a number of political types on Twitter taking a victory lap based on this number:
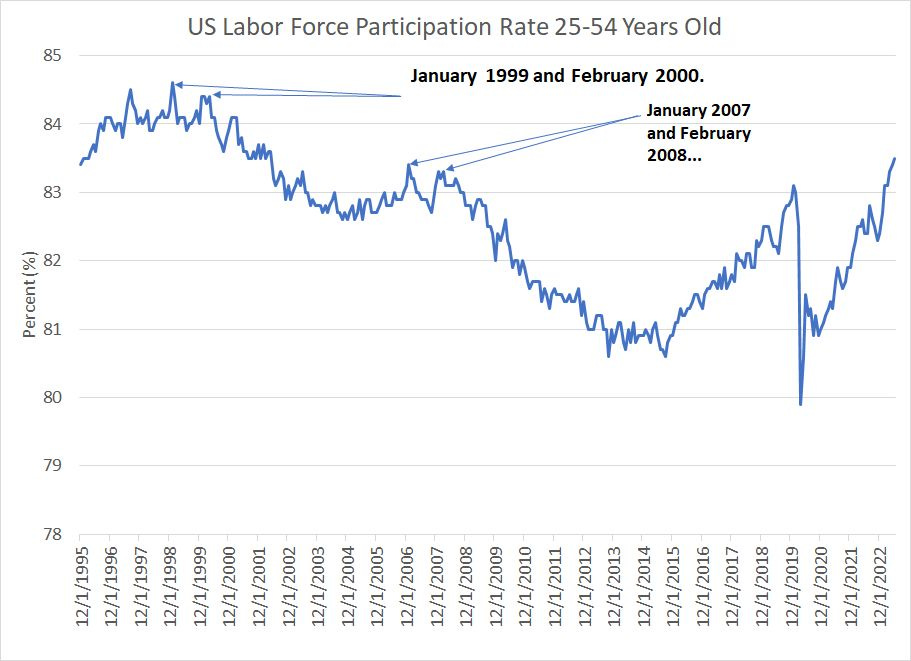
Source: Bureau of Labor Statistics, Bloomberg
This chart shows the total number of people aged 25 to 54 years old – considered the prime working age – who are either employed, or unemployed and looking for work. Clearly, you’d expect most people in this age group to have a job or, at a minimum, be looking for a job.
Well, in June this participation rate hit a 21-year high, leading to Tweets like this one from President Biden:

Source: Twitter
It’s only natural a sitting President would want to highlight strong economic data; every President in my lifetime has done so, from both major political parties.
However, while a rising labor force participation rate is good news, it typically rises and peaks near the top of an economic cycle. I’ve labeled some of the key dates on my chart above, but you can see the very strong readings from January 1999 to February 2000 immediately preceded the 2001 recession and 2000-02 bear market while the 2007-08 readings came just before and after the start of the 2007-09 Great Recession.
Here's a different look:
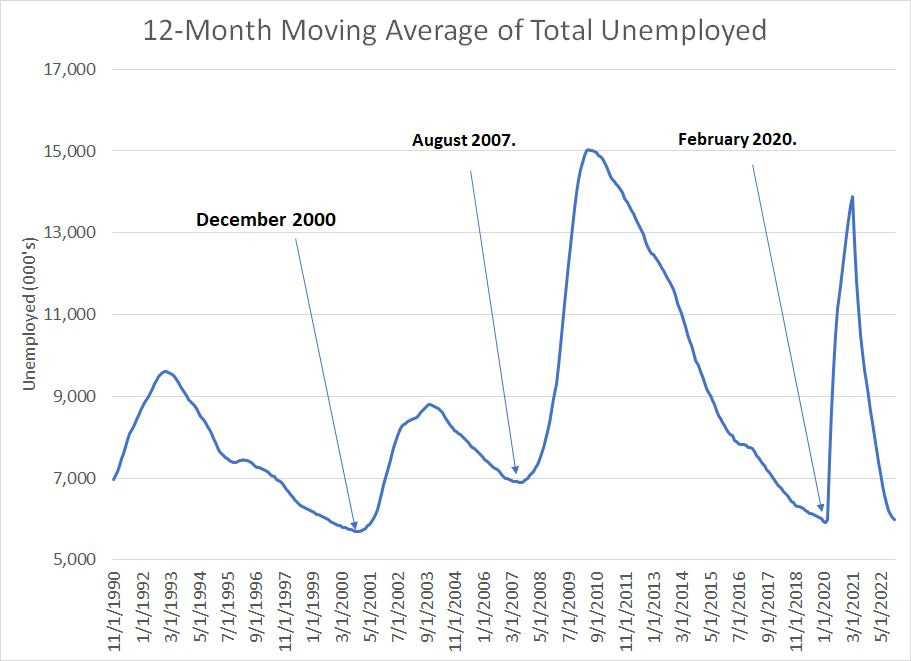
Source: BLS, Bloomberg
To create this chart, I simply took a 12-month moving average of the total number of unemployed people included in the monthly BLS report. As you can see, the total number of unemployed tends to bottom out just as the economy is entering into recession; when this average starts to rise, look out, because a recession is likely already underway.
The dates I’ve flagged here are ominous – December 2000, three months before the start of the 2001 recession and August 2007 just before the start of the December 2007 to March 2009 Great Recession.
The unpleasant lesson: Employment is a lagging indicator, and many aspects of the monthly report will tend to look best just before Mr. Market pulls out the proverbial rug and the economy slips into recession.
Lastly, here’s a series buried within the BLS report that I’ve written about before:
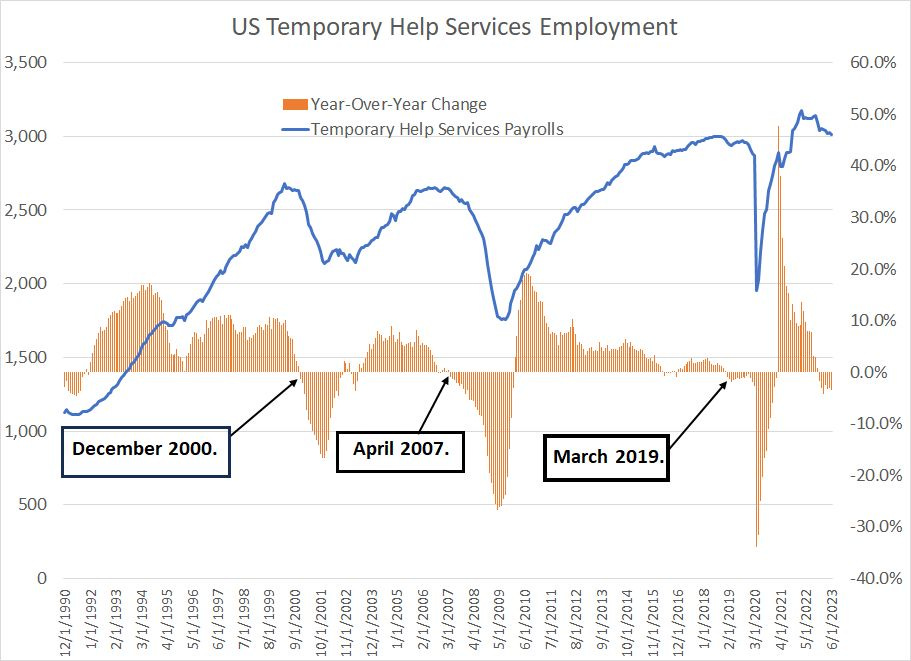
Source: BLS, Bloomberg
The blue line on this chart shows the total number of people employed by temporary help services – these are companies that provide temporary employees to companies, generally to help meet short-term spikes or lulls in business activity.
The orange bars show the year-over-year change in temporary help employment and I’ve labeled some major turns in the data over the last 30+ years.
(The government only reports this series back to 1990, so we can’t examine cycles prior to that).
There’s a concept known as labor hoarding that accounts, in part, for the lagging nature of employment data. The basic idea is that it’s expensive to find and hire suitable employees and give them the training they need to perform their tasks. It’s also expensive to lay off employees or tempt workers into early retirement.
So, when the economy begins to slow and businesses begin to see a decline in demand for their products or services, they’re loathe to immediately cut costs by laying off workers. The danger there is that demand re-strengthens and they’re left understaffed once again, forcing a need to identify, hire and train workers once again at a high cost.
So, companies will often begin with other steps. Examples include reducing hours and overtime for employees paid on an hourly basis, or simply reducing the number of temporary workers on payroll. Most temporary workers are actually employed by the temporary staffing agency itself, so there’s modest cost for the company to reduce payrolls in this manner.
Thus, to assess the strength of the labor market, you don’t want to look at the headline payrolls data as much as the more sensitive components including this temp help series. As you can see, the year-over-year change in temporary services employment tends to turn negative just ahead of a broader weakening in the economy and employment.
Sometimes it can take a few months for weakness in temporary help services to show up in the monthly headline BLS numbers, but that’s already happened in this cycle. The year-over-year change in temporary employment first turned negative in December 2022, so the clock is ticking; perhaps the weaker than expected headline payrolls gain in June, the big downside revision to April-May data and the deterioration in initial jobless claims data over the past few months are the first signs of the creeping spread of labor market weakness.
Later this week, the market’s attention will turn toward this:
Earnings Season is Ahead
For me, JP Morgan (NYSE: JPM)’ss quarterly earnings release marks the unofficial kick-off of earnings season for the S&P 500.
And the financial giant is due to report on July 14th before the opening bell. Heading into the report, investors look pretty bullish – on Monday July 3rd, JP Morgan closed at $146.61, the highest since early 2022 and comfortably above a technical resistance level at $144.
Wall Street seems convinced the (mild) earnings recession for the S&P 500 is nearly complete:

Source: Bloomberg
In 2022, one major headwind facing stocks was that analysts steadily revised down their estimates for S&P 500 profits.
However, those downside revisions have largely stopped this year. For Q2 2022, Wall Street is looking for S&P 500 earnings to decline about 8.9% year-over-year; however, the year-over-year comps are expected to turn more positive in Q3 with earnings down just 1.1% year-over-year.
And, by the final quarter of 2023 the year-over-year growth in S&P 500 profits is expected to run to +6.4%; interestingly, expectations for Q4 2023 S&P 500 profits are largely unchanged since February. In Q1 2024, S&P 500 earnings are expected to grow by 8.5% year-over-year; by the end of 2023, Wall Street sees a renewed earnings upcycle for US stocks.
Perhaps analysts are right. It’s possible big US companies like JP Morgan will beat expectations or even guide expectations higher for the next few months.
However, what’s clear is that with investor sentiment towards stocks turning more bullish and analysts already expecting earnings to start growing year-over-year by the end of 2023, there’s a lot more good news baked into market valuations than was the case just six months ago. That leaves room for disappointment.
Bottom line: I am not saying the market has peaked. Indeed, technicals, which dominate the short-term market outlook, continue to point to additional upside ahead.
However, it pays to remain situationally aware of the dangers lurking around the bend, particularly the fact that investors and Wall Street analysts appear to be turning bullish just as some of the macroeconomic fundamentals are showing cracks.
DISCLAIMER: This article is not investment advice and represents the opinions of its author, Elliott Gue. The Free Market Speculator is NOT a securities broker/dealer or an investment advisor. You are responsible for your own investment decisions. All information contained in our newsletters and posts should be independently verified with the companies mentioned, and readers should always conduct their own research and due diligence and consider obtaining professional advice before making any investment decision.