


Rotation's Turn
The rise of the laggards...

The US equity market has suffered notoriously bad breadth this year with only a handful of large-cap names dragging the broader market higher.
In fact, as recently as November 9th, the S&P 500 Equal-Weight Index was still down on a year-to-date basis, including dividends paid.
Year-to-date through mid-November, the Russell 2000 Index of small-cap stocks was on pace for its second-worst performance relative to the S&P 500 since 1980, lagging the S&P 500 by as much as 18.54 percentage points:
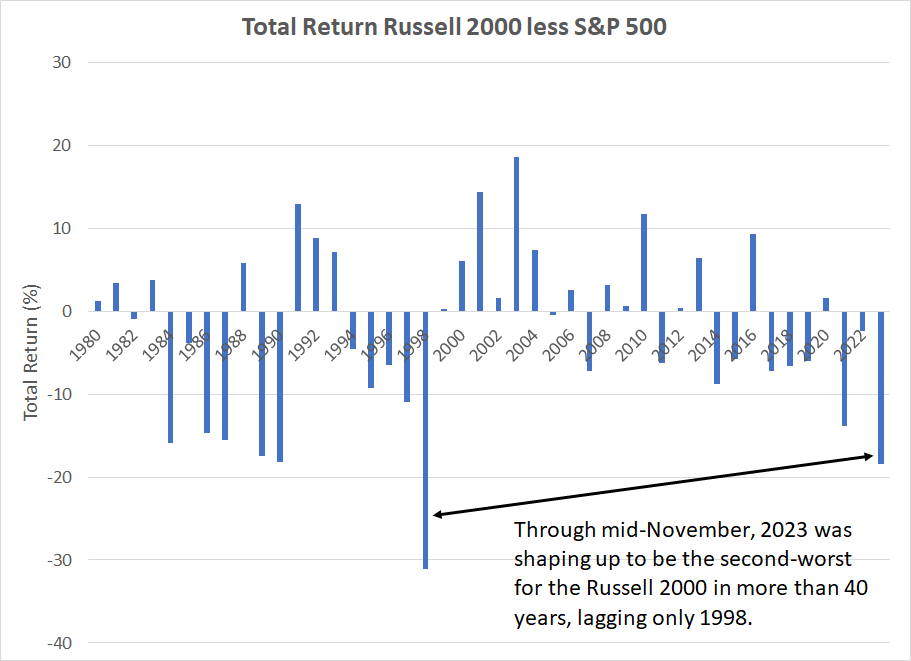
Source: Bloomberg
As you can see, the only other year in the past 43 where the Russell 2000 has underperformed the S&P 500 by a larger margin was 1998, a year when the S&P 500 managed a more than 28% gain while the Russell was down 2.5% for the year.
Of course, even with most stocks down for the year, the talking heads in the financial media continued chattering away about a new equity bull market with the S&P 500 up close to 15% and the Nasdaq 100 up an impressive 39.6% over a similar holding period.
There is some good news on the breadth front:
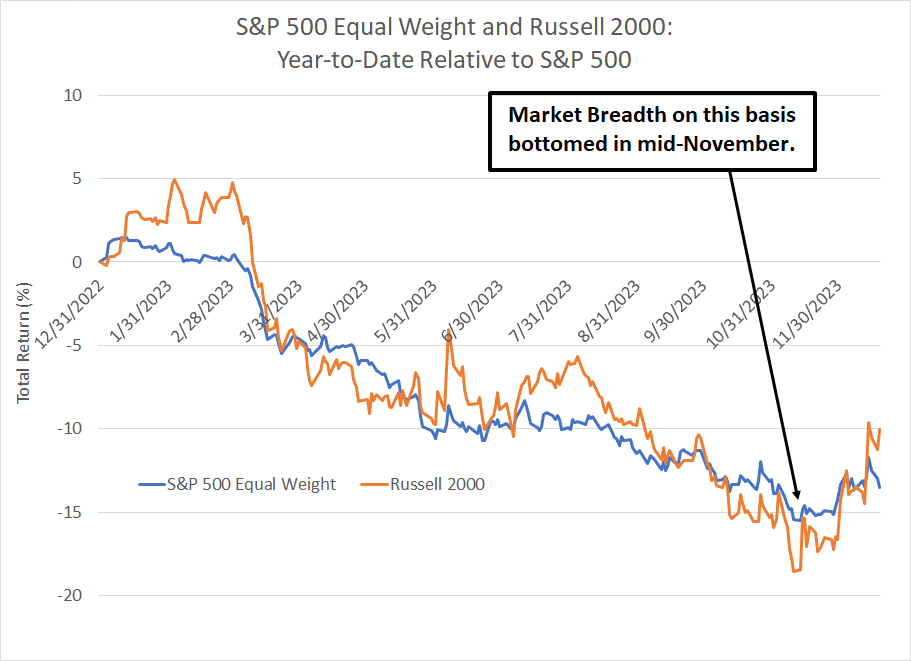
Source: Bloomberg
This chart shows the performance of both the Russell 2000 (orange) and S&P 500 Equal Weight indices relative to the S&P 500 year-to-date.
As you can see, breadth on this basis bottomed out in mid-November. Indeed, since the close on November 13th, the Russell 2000 and S&P 500 Equal Weight indices are up 16.5% and 11.4% respectively compared to a gain of “only” 7.7% for the S&P 500 and 8.13% for the Nasdaq 100.
I’ve written about the market’s seasonal strength into year-end before in The Free Market Speculator and, in the model portfolio that’s part of the paid tier of this service, I added a sizable position in the iShares Russell 2000 ETF (NYSE: IWM) back on November 15th “Model Portfolio Moves and Rotation.”
Through the end of December I’m offering 90-day free trials to the paid tier of The Free Market Speculator, which includes our model portfolio recommendations and special subscriber-only content and alerts.
Try the paid tier of The Free Market Speculator for the next 90 days, and if it’s not for you, for any reason whatsoever, simply cancel before your trial is up and you won’t be charged for the service.
This special Christmas offer is available ONLY through this link:
My rationale for adding IWM to the model FMS portfolio back in mid-November was based primarily on a short-to-intermediate term view that small-caps could play catch-up with the broader market into early 2024.
As I’ll explain a bit later on in this post, I believe all the ingredients are in place for a longer-term multi-year rotation in US markets, favoring small-caps and many of the groups that have lagged the broader market through much of 2023.
Let’s start with two points about the short-term set-up for the Russell.
Small Caps in the Short Run
First, significant small-cap underperformance through the first 10 months of the year has a strong tendency to mean-revert in the final two months of the year.
There have only been 7 years in the past 33 (excluding this year) where the Russell 2000 has underperformed the S&P 500 by more than 7.5 percentage points through October 31st, which is roughly half the underperformance we saw through the first 10 months of 2023.
In six of those 7 cases, the Russell 2000 went on to outperform the S&P 500 in the final 2 months of the year (85.7% of the time) by an average of 3.9 percentage points.
On the single occasion (out of 7 cases since 1990) where the Russell went on to underperform the S&P 500 in the final two months of the year (1998) the Russell 2000 underperformed by just 0.42% and was still higher by 11.75%. Relative performance notwithstanding that’s a strong finish.
Even better, out of the seven years that brought a narrow market rally through the first 10 months of the year, there’s not a single instance where the Russell 2000 did NOT produce a positive return to end the year – the average total return for the Russell 2000 from October 31 through December 31st is more than 12.33%.
Second, there’s good precedent for small cap strength to continue into 2024:
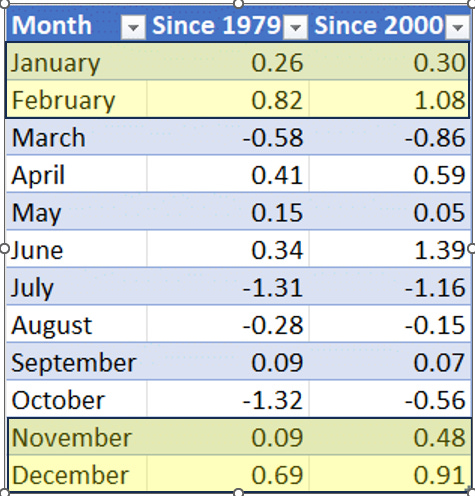
Source: Bloomberg
To create this table, I examined the average monthly total return on a dividends-reinvested basis for the Russell 2000 and S&P 500 since 1979. The numbers presented in the table show the average total return for the Russell less the S&P for each month of the year where a positive number denotes small cap outperformance.
As you can see, there’s a clear seasonal tailwind for small caps from November through February; even better, the effect is stronger in the period since 2000 than for the entire dataset (post-1979).
I am not a believer in all-powerful seasonality – these patterns can, and do, break down in some years.
However, when you couple this positive small-cap seasonality with the mean-reversion set-up for the Russell 2000 I just outlined, the ingredients are in place for the Russell to break above a key resistance level that’s acted as a ceiling for the index since mid-2022:
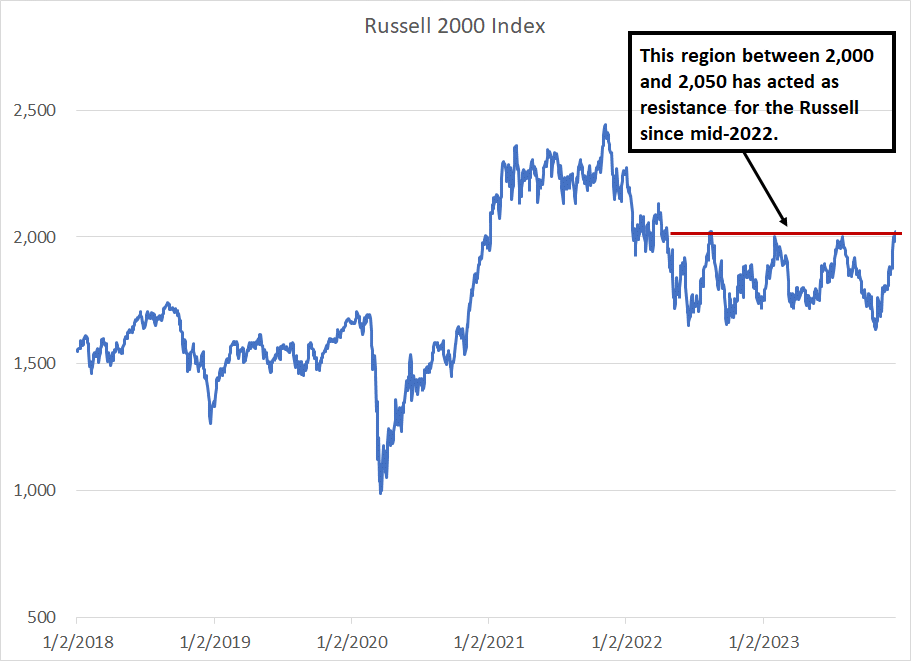
Source: Bloomberg
This chart of the Russell 2000 shows the index is currently testing a clear resistance level marked in red between roughly 2,000 and 2,050.
That’s a level that’s held multiple rallies since the middle of 2022; if the index does break out, it’s not unreasonable to expect a return to near the all-time highs for the Russell around 2,460.
Let me warn you, I do not expect such a move to proceed uninterrupted — in financial markets, straight lines always make me nervous. There will likely be pullbacks and retests of recent support along the way.
And with the Russell 2000 overbought and challenging that key resistance level, right now is not a great time to get aggressive buying small stocks:
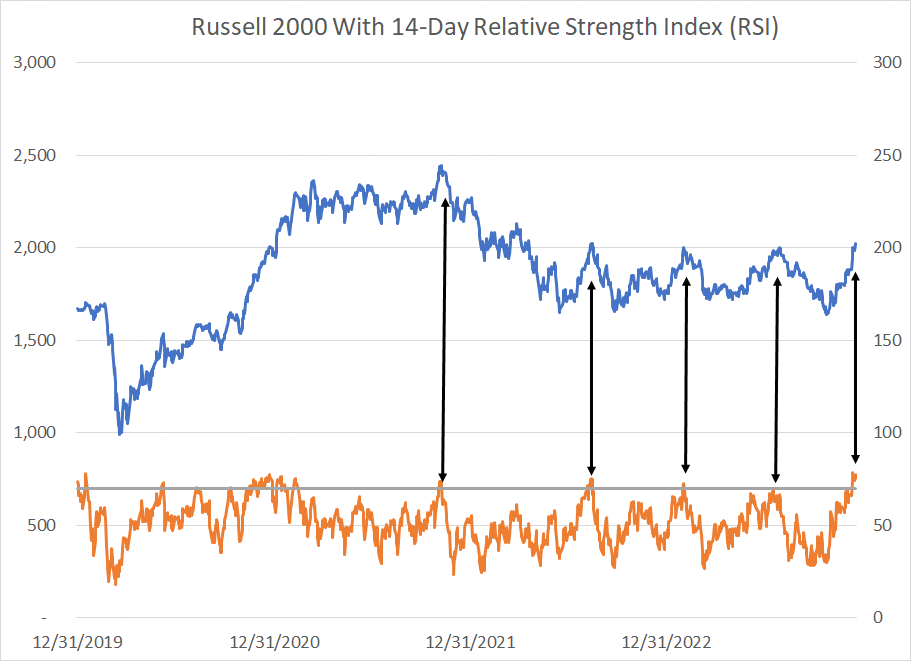
Source: Bloomberg
This chart depicts the Russell 2000 in blue (left-hand scale) and the 14-Day Relative Strength Index in orange (right-hand scale) since the end of 2019. For those of you unfamiliar with RSI, I covered this indicator in a video back on November 26th “The Market’s Secret Volatility.”
As you can see, when the RSI rises above 70 (the grey line) that’s usually a good signal to consider trimming your exposure to small caps, at least in the short run. This is an even more powerful signal when you see an overbought reading coupled with a test of obvious resistance, such as we’re seeing right now.
I’ve labeled a few prior examples with double-sided black arrows in my chart above.
As a matter of full disclosure, for those of you who are not in the paid tier of FMS – just last week, I did recommend trimming the recommended position in the FMS model portfolio slightly, booking a profit since recommendation.
Given the inherent volatility in liquidity-driven markets – see Stealth Easing and Bank Reserves – I believe it’s prudent for even longer-term investors to consider a more active approach to managing positions over time. A key facet of that is to consider scaling into and out of positions over time, by buying and selling new positions in increments rather than all at once.
And that brings me to the case for a longer-term rotation into small-caps and other laggard groups in 2024:
Multi-Year Rotation Cycles
Small-cap relative strength historically moves in multi-year cycles.
According to data from Bank of America, US small cap stocks handily beat the broader stock market in every year from 1974 to 1979, a period of stubbornly high inflation.
And, from 1965 through 1979, smaller US stocks beat the S&P 500 in 11 of those 15 years, outperforming through the late 1960s and, as I just noted, through the mid and late 70s.
Here’s a look at the relative strength of the Russell 2000 Index compared to the S&P 500 since 1980:
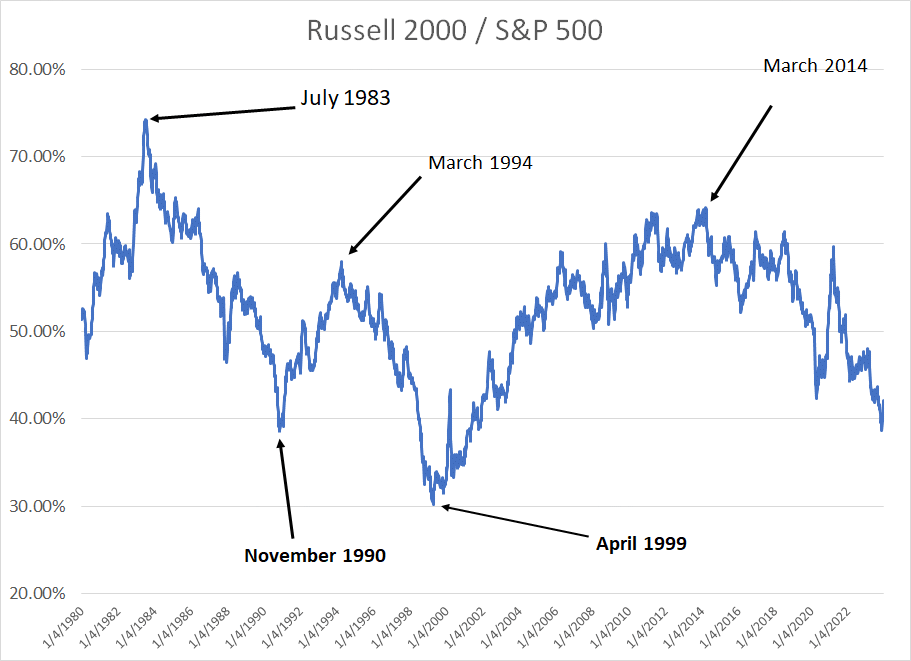
Source: Bloomberg
This chart is constructed such that a rising line suggests small cap outperformance (relative strength), while a falling line indicates the opposite.
I’ve labeled some of the key dates on my chart.
For example, you can see that small-cap outperformance through the mid and late 1970’s continued until roughly mid-1983, then small-caps entered a prolonged period of underperformance that ended in late 1990.
Small caps then enjoyed about a 3.5 year “bounce” before the late 1990’s technology and “dot-com” boom years; small-caps reached record relative weakness in 1999 about a year before the Nasdaq bubble peaked in March 2000. That weakness was followed by a near 15-year long period of strength and, finally, almost a decade of underperformance since the spring of 2014.
Over the past few months, the relative strength of the Russell 2000 to the S&P 500 has reached lows not seen the final blow-off peak of the tech bubble years from late 1998 to early 2000.
I can tell you from first-hand experience in the late 1990s, few believed in a durable rally in small caps at the time – the market was all about large-caps and tech in that era.
In that regard, the recent narrow stock market rally bears a striking resemblance to the late 1990s tech bubble years:
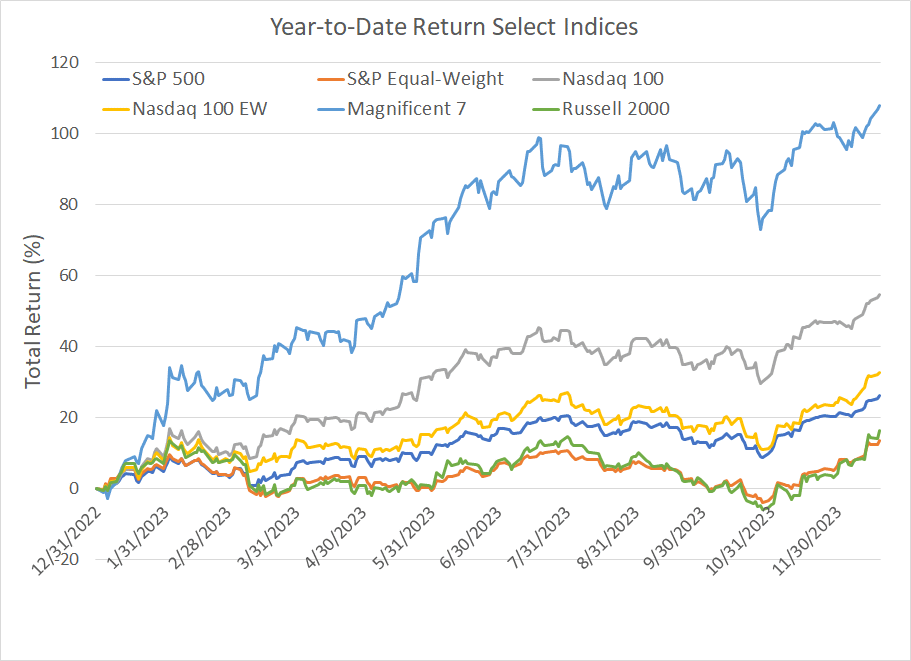
Source: Bloomberg
So far in 2023 it’s a triple-digit gain in seven stocks (the Magnificent 7) that’s dragged market cap weighted indices like the S&P 500 and the Nasdaq 100 higher while any index with little or no exposure to the Mag 7 – the S&P 500 Equal Weight and the Russell 2000 being two examples – has traded sideways for much of this year.
Three general points.
First, looking at the multi-year cycles in small-cap outperformance over the past 43 years, it would seem the Russell is “due” for turn in the sun after 10 years of grinding underperformance.
Second, the level of my relative strength index above is broadly in-line with the major cycle lows witnessed in 1990 and 1998-2000.
Third, the melt-up in a handful of popular growth stocks this year is eerily reminiscent of that final push higher in the Nasdaq and stocks like Cisco Systems (NSDQ: CSCO) to the highs in March 2000. This also coincides with a period of small-cap strength that accelerated despite the recession of 2001.
This is also reminiscent of the Nifty 50 melt-up rally in large-cap growth stocks back in the 1960s that gave way to a prolonged period of small cap outperformance through the late 1960s and 1970’s.
Could this be the last gasp of the growth/tech trade ahead of a multi-year period of small-cap underperformance as it was in 2000-14?
Of course, There’s no way to know with any degree of certainty, however, the patterns do line up.
And I must admit the thought of recommending small cap stocks back in mid-November for the FMS model portfolio elicited a “fight or flight” response for me – there have just been so many false dawns for small caps since 2014, and the group is so out-of-favor, it’s not a comfortable trade.
It’s usually the least comfortable and most out-of-favor calls that lead the strongest returns.
And that brings me to this:
Revenge of the Old Economy
Investors of a certain vintage will recall all the talk of the “Old Economy” and the tech-enabled “New Economy” back in the late 1990s. The idea was new technologies were disrupting the global economy, a shift some feared might lead to the death of certain industries and profit models.
Of course, creative destruction and disruption are a feature, and not a bug, of capitalism and free markets. Indeed, the Internet (basically the focus of the late 90’s boom) has changed our lives, and upended business models over the past 23 years.
However, when you start reading articles about the death of the Old Economy, it’s a good sign the trade might already be the Wall Street consensus, already baked into market valuations, and due for a reversal.
That certainly seems to be the case right now.
Back in July “Deconstructing Market Returns,” I wrote about the 3 basic drivers of returns from the stock market:
Changes in earnings (profits) for the portfolio of stocks you own, or the index in question.
Changes in the multiple paid for those earnings (the price to earnings ratio).
Dividends paid.
We can actually divide the return from an index into these three components to ascertain what’s driving market gains:

Source: Bloomberg
This table (click the table to enlarge) lays out these three return drivers for several indices both in the US and globally year-to-date 2023 (through last Friday the 15th). Note that I am using local currency returns for the FTSE 100 (United Kingdom), the Euro Stoxx 50 (Eurozone) and Japan’s TOPIX Index.
In each case, the Dividends row is simply the difference between the pure price return for each index and the total return assuming you simply receive dividends paid in cash (not reinvested).
The Earnings row shows the change in consensus earnings estimates for each index since December 30, 2022 on a blended forward 12 months basis.
Finally, the Multiple Expansion line shows the difference between the actual price return from each index and the price return assuming the price-to-earnings ratio for each index were held at the year-end 2022 level.
The multiple expansion line – rising valuations – has been a positive driver for returns in every index on my table this year.
However, what’s really striking is the sheer scale of the contribution from expanding multiples for some of the indices on my table including the Magnificent 7 and the Nasdaq 100. Expanding multiples added more than 54% to returns from the Magnificent 7 so far in 2023 alone.
In a sense that makes fundamental sense.
After all, the Mag 7 and Nasdaq 100 are also standouts in terms of growth in earnings and earnings estimates this year – for the Nasdaq 100, blended forward earnings estimates are up almost 27% so far in 2023, a whopping 21 percentage points higher than for the S&P 500 as a whole.
Meanwhile, for the Mag 7, estimates have soared close to 50% compared to just 5.7% for the S&P 500.
Simply put, in a market dominated by restrained growth in earnings estimates this year, the fast-growing Magnificent 7 and Nasdaq 100 have some growth scarcity value. The rising multiple represents investors’ willingness to “pay up” for those rare growth stories.
However, eye-popping returns driven by significant multiple expansion are dangerous:
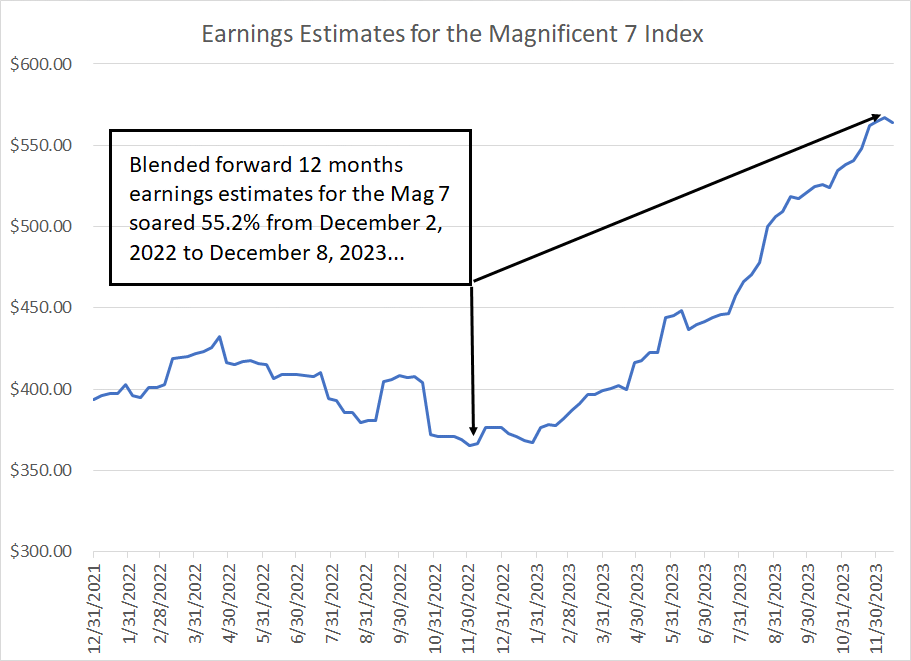
Source: Bloomberg
As you can see, earnings estimates for the Magnificent 7 soared more than 55% between early December 2022 and December 8th of this year.
These are NOT small stocks, they’re some of the largest companies in the US and they already dominate the S&P 500 and Nasdaq 100. Simple logic dictates that it’s very difficult for these industry behemoths to maintain growth of that scale for long.
As Tesla CEO Elon Musk put it on the company’s Q3 2023 Conference call:
It's not possible to have a compound growth rate of 50% forever, or you will exceed the mass of the known universe. So -- but I think we will grow very rapidly, much faster than any other car company on earth by far.
Source: Tesla Q3 2023 Earnings Conference Call
And we’re already seeing what can happen when a company reports strong earnings, but fails to impress or exceed already high expectations on Wall Street.
Alphabet (NSDQ: GOOGL), a member of the Magnificent 7, beat quarterly earnings estimates when it reported results on October 24th by more than 7%; yet, the stock tumbled 9.5% on the day following its release.
NVIDIA (NSDQ: NVDA), the top-performing stock in the S&P 500, the Nasdaq 100 and the Magnificent 7 Index year-to-date beat earnings estimates by almost 20% last quarter and raised guidance. The stock still fell a bit over 2.5% in the day after its earnings release.
Indeed, since the middle of October, the start of Q3 2023 earnings season in the US, the Magnificent 7 has underperformed the S&P 500 by about 1.25%, the S&P 500 Equal Weight by 3.25% and the Russell 2000 by more than 8.5%.
One of the biggest problems with consistently blowing away expectations is that investors begin to expect it, and as earnings multiples expand, it can become increasingly difficult to clear that ever-rising bar of expectations.
In short, multi-year rotations between sectors and investment styles are a feature of financials markets. Given the scale of technology and growth leadership over the past decade and elevated valuations in the group, the ingredients are in place for 2024 to be a rotation year and for laggard groups to become the new market leaders.
DISCLAIMER: This article is not investment advice and represents the opinions of its author, Elliott Gue. The Free Market Speculator is NOT a securities broker/dealer or an investment advisor. You are responsible for your own investment decisions. All information contained in our newsletters and posts should be independently verified with the companies mentioned, and readers should always conduct their own research and due diligence and consider obtaining professional advice before making any investment decision.