

Russia's Invasion was Bearish Oil
Russia's Invasion was Bearish Oil
Oil market balances now tilting in favor of the bulls

Pundits in the mainstream media routinely dismiss the 2022 rally in oil prices as the consequence of supply disruptions following Russia’s invasion of Ukraine in February last year.
The opposite is true.
Yes, the invasion sparked concerns about Russian oil supply and a (very) short-term spike in oil prices early last year. However, faced with rising military spending, Russia quickly turned to surging oil exports as a a source of funding.
Consider this chart:
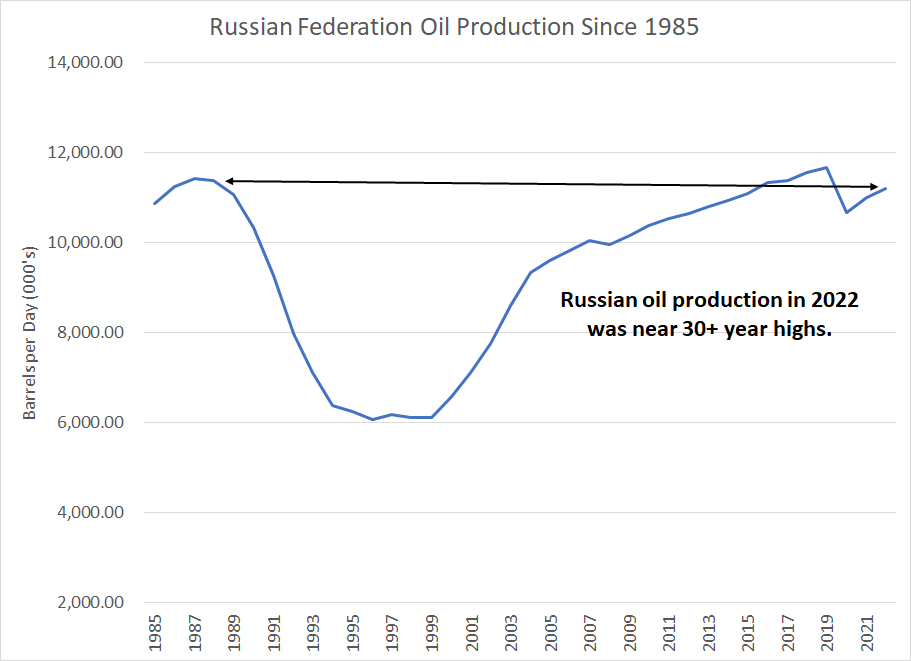
Source: Energy Institute Statistical Review of World Energy
According to the Energy Institute, Russian oil production of 11.2 million bbl/day in 2022 was up 1.8% compared to 2021 and near the highest levels since the late 1980s.
The last time Russia meaningfully reduced output was in 2020, amid a deal with OPEC to address the post-COVID collapse in oil prices.
Take a quick glance at our chart and you’ll see history repeats -- Russian production also ramped up in the late 1980s in the waning days of the USSR, and heavy military spending amid the Cold War.
Simply put, following the invasion of Ukraine in February, Russian barrels sold at a discounted price to willing buyers like China and India supplanted barrels supplied by other producers at higher, market prices. Physical volumes of oil Russia supplied to the world market actually rose last year.
Further, we doubt the US would have sold 275 million barrels of oil from the Strategic Petroleum Reserve (SPR) since late 2021 — the largest release in history — in the absence of the Russian invasion of Ukraine:
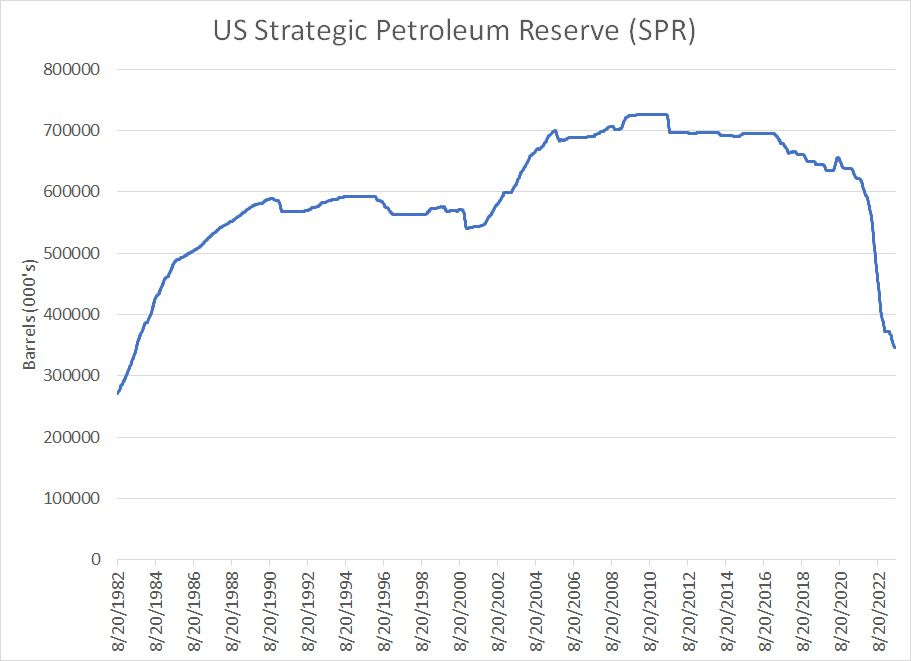
Source: Bloomberg
On March 31, 2022 the White House issued a press release titled “FACT SHEET: President Biden’s Plan to Respond to Putin’s Price Hike at the Pump.” This is only one of many examples where the Biden Administration tied justification for historic SPR oil sales to Russia’s invasion of Ukraine.
The US Strategic Petroleum Reserve (SPR) now holds less than 350 million barrels of crude oil, the lowest since mid-1983, 40 years ago.
However, this summer supply-demand balances in the global oil market are increasingly tilting in favor of the bulls and the fading surge in Russian exports is turning into a significant tailwind for prices.
Something Has to Give
I wrote about oil market fundamentals back in the late June issue, Oil’s Recession Warning, indicating something had to give in the global oil market.
Specifically, with global demand strong in the first half of 2023 and OPEC slashing output, the supply-demand balance was tightening; yet, West Texas Intermediate (WTI) oil prices continued to languish around $70/bbl.
The only way that scenario makes sense is if you expect a serious drop in global demand in the second half of 2023 — I’m talking about demand destruction of the magnitude experienced in the second half of 2008, amid what’s arguably the most severe recession and credit crunch of the post-war era.
Let’s take a look:
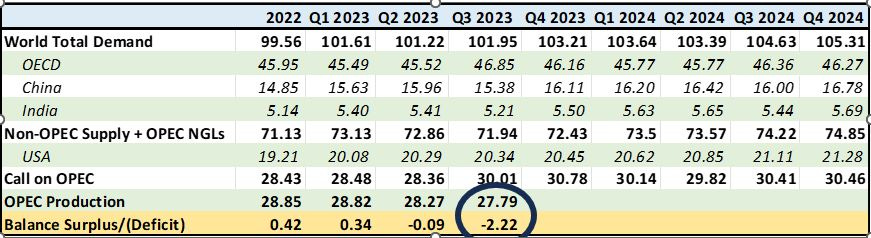
Source: OPEC July Monthly Oil Market Report
This chart shows OPEC’s own historical data and estimates for the oil market supply/demand balance for calendar year 2022 as well as Q1 2023 through Q4 2024.
Total global oil demand – the top row on my table – includes oil itself as well as some volumes of natural gas liquids (NGLs). NGLs are hydrocarbons like butane and natural gasoline naturally occurring in certain oil and natural gas wells. Under that demand total I’ve broken out demand from OECD countries (developed world) as well as China and India, two leading emerging market oil consumers.
Let’s run through some assumptions baked into these demand estimates.
Some of the increase in OECD oil demand from 2022 through the first half of 2023 is due to economic reopening in many developed countries from COVID-era restrictions and the consequent recovery in travel demand. There’s also a significant seasonal pattern evident in OECD demand – demand for oil is highest in Q3 and Q4 of each year which includes the all-important summer driving season.
For China, in particular, the recovery in demand into the first half of 2023 is due in large part to economic reopening from the country’s draconian Zero COVID “strategy” last year, which severely impacted travel demand.
Of course, economic data out of China has been disappointing of late, calling into question the scale of any demand recovery:
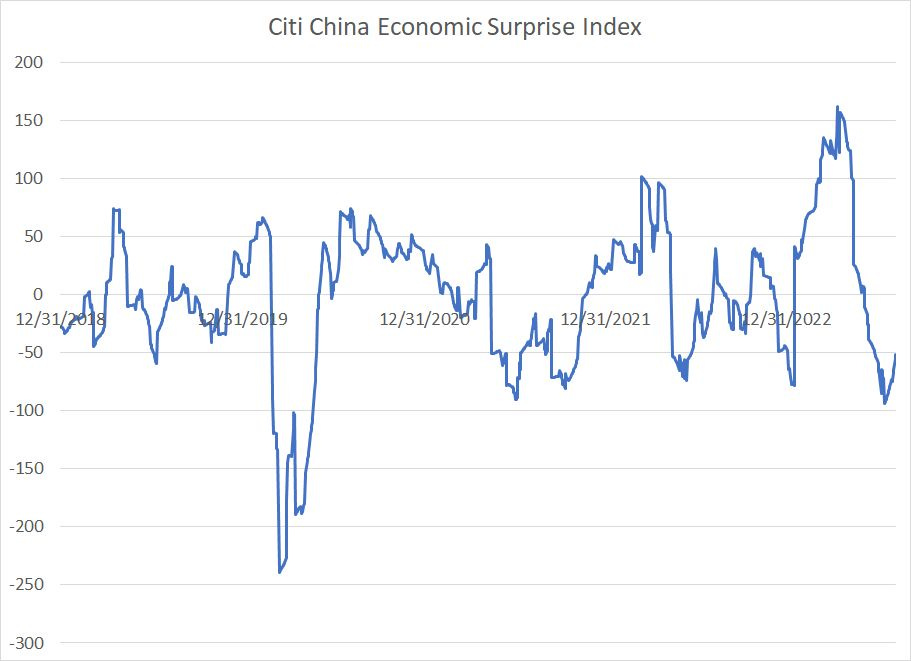
Source: Bloomberg
The Citi Economic Surprise Index measures incoming economic data against economists’ expectations such that a negative number indicates data that’s worse-than-expected, and a positive number the opposite.
As you can see, apart from early 2020 – the height of COVID lockdowns in China – this index is near the lows of the past 5 years.
Thus, you could say there’s downside risk to China demand estimates here. However, OPEC estimates for Chinese oil demand into early next year don’t appear particularly demanding — the cartel sees demand falling from 15.96 million bbl/day in Q2 2023 to 15.38 million bbl/day in Q3, rising back to 16.11 million bbl/day in Q4.
Moreover, it’s widely expected the Chinese government is unwilling to tolerate too much economic weakness and will announce significant stimulus later this year to support growth. Depending on the scale of any such plan, history suggests there’s also material upside risk to Chinese demand estimates.
The Call on OPEC
The next major category in the table is the row labeled non-OPEC supply plus OPEC NGLs. OPEC excludes certain NGLs volumes from official production quotas, lumping these volumes into their non-OPEC supply category.
I’ve also broken out the contribution to global supply from the US, which includes crude oil and some US NGLs production volumes.
As you can see, OPEC has penciled in modest non-OPEC production growth over the coming year – about 2.28 million bbl/day from Q3 2023 to Q3 2024 – with about 770,000 bbl/day of that growth expected from the US. So, OPEC is certainly not ignoring the potential for non-OPEC volumes to rise somewhat over the next year.
Regardless, the key row to watch here is the “Call on OPEC.” This is defined as total global oil demand less non-OPEC production; it’s the quantity of oil OPEC members must supply each quarter to keep the oil market in balance.
If OPEC pumps less than the call, global oil inventories will tend to decline as refiners pull crude from storage to meet demand. The opposite is true when OPEC pumps more than the Call, which tends to loosen global supply/demand balances.
Last year, despite all the talk of supply disruptions resulting from the Russian invasion of Ukraine, and despite all the rhetoric from Washington demanding OPEC pump more crude, the cartel estimates that the global oil market was actually in surplus.
In Q1 2023, OPEC still pumped more than the Call, resulting in a build in inventories and, generally, the downward pressure on oil prices we saw early this year. However, following additional supply cuts from the cartel starting in May and unilateral cuts from Saudi Arabia starting July 1st, the oil market started to tighten in Q2 2023 and into early Q3.
I believe the current quarter – Q3 2023 – will be critical for the global oil market. As you can see, due to a combination of some increase in demand and a seasonal decline in non-OPEC output, the cartel sees the call on OPEC rising to just over 30 million bbl/day this quarter.
In Q2, OPEC production was just 28.27 million bbl/day, some 1.73 million bbl/day below that Q3 2023 “Call on OPEC.”
And, just remember, Saudi Arabia announced a unilateral production cut of 1 million bbl/day starting July 1st and has since extended those cuts at least through the end of August; ultimately, we see Saudi extending their unilateral cuts through to late 2023.
So, OPEC production is set to fall significantly from Q2 2023 to Q3 2023.
Let’s take a look at Bloomberg estimates for OPEC oil production in July:
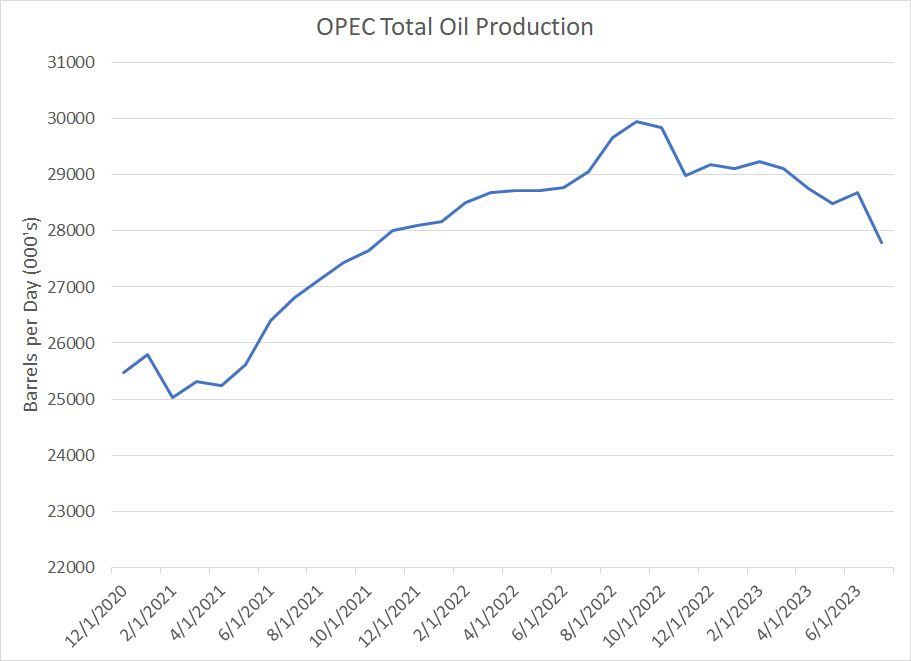
Source: Bloomberg
According to Bloomberg, OPEC produced a total of about 27.79 million bbl/day of oil in July, down 900,000 bbl/day from June levels. That’s almost entirely due to Saudi Arabia, where production is down 810,000 bbl/day sequentially, consistent with the Kingdom’s unilateral production cuts starting July 1st.
Bloomberg estimates for OPEC production are generally somewhat higher than OPEC’s internal estimates, but let’s just take the Bloomberg July estimate as a good starting point. As you can see in my table above, if we assume that 27.79 million bbl/day of OPEC production remains constant through the final two months of Q3 2023 (August and September) then OPEC is pumping more than 2.2 million bbl/day under the Call on OPEC (circled in the table).
That’s an enormous deficit for the global oil market, implying a significant draw in inventories globally and likely much higher prices.
So, is it plausible the global oil market could tighten to that degree in coming months?
There are signs that’s already happening. After all, the US reports data on oil inventories weekly, arguably the most visible high-frequency datapoint on the global oil market. And in the week ended July 29th US commercial oil inventories fell by a record of more than 17 million barrels. In the week ended August 5th, inventories only recovered by 5.85 million barrels.
Further, this week, US inventories of motor gasoline, the key fuel for summer driving season, reached the lowest levels in more than 5 years.
Back to Russia
Also, remember that while Russia is allied with OPEC and has agreed to production quotas working in concert with the cartel, it is NOT an OPEC member and Russian production volumes are part of the non-OPEC supply row in my table above.
As I noted, neither Russia’s invasion of Ukraine nor subsequent sanctions or price caps imposed on Russian barrels cut the actual volume of oil the country exports. Quite the opposite – to fund military spending, Russia ramped up its output and more or less ignored the quotas agreed with OPEC.
However, back in early July Russia announced it would cut oil exports by 500,000 bbl/day in August, and there are signs seaborne exports are finally starting to fade:

Source: Bloomberg Tanker Tracking Data
As you can see, Russian seaborne oil exports ramped higher in the first half of 2023, despite the G-7 imposed cap on Russian oil prices but have faltered this summer.
Note that seaborne exports are only part of Russia’s total exports of oil; however, swings in tanker exports are a good guide to near-term changes in the country’s production volumes.
Bottom line: OPEC supply constraints since last spring coupled with the normal seasonal ramp in oil demand this summer appears to be resulting in a significant tightening in the global oil market right now, along the lines forecast in OPEC’s monthly oil market report.
As I outlined back in June, something had to give in the global oil market this year.
The only plausible way to square sub-$70/bbl WTI prices as recently as late June with ongoing supply cuts from OPEC was through the demand side of the equation – as you can see in our table above, global oil demand would have to fall some 2 million bbl/day lower than OPEC forecasts through the second half of this year for the oil market to balance.
That’s a tall order indeed:
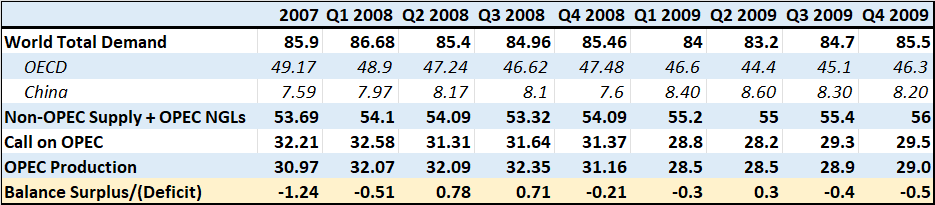
Source: OPEC Annual Reports for 2008 and 2009
This table shows the oil market balances reported in OPEC’s annual reports for 2008 and 2009 published in early 2009 and early 2010 respectively. The format is broadly similar to the projections for 2023 and 2024 I showed you earlier.
Recall that in 2007 WTI oil prices rose by almost 60% to end the year at $95.98/bbl. By June 2008 WTI had rallied to more than $145/bbl. Look at my table above and this rally makes more fundamental sense – in 2007, the global oil market faced a deficit of 1.24 million bbl/day and global inventories fell.
And here’s what’s crucial: The oil market continued to look tight into early 2008 even as the global economy slipped into one of the worst economic downturns of the post-war era compounded by a credit crunch. In Q1 2008, the oil market faced a deficit of more than 500,000 bbl/day, which is unusual for that time of year since Q1 is usually a period of weaker demand.
However, starting in Q2 2008 global demand began to weaken and deteriorated further in Q3 2008, a time of year when you typically see a surge in seasonal demand due to summer driving season in the Northern Hemisphere, home to some 90% of the global population.
With the oil market in surplus of 700,000 to 800,000 bbl/day in Q2 and Q3, oil prices finally cracked, falling to a low of around $34/bbl for WTI on December 19, 2008.
However, it’s important to emphasize the fact the 2007-09 Great Recession was arguably the worst economic downturn of the post-war era and the total global drop in demand from Q1 to Q3 2008 was about 1.72 million bbl/day.
Just as important: Look at our table above and you’ll see OPEC responded to the rapid deterioration in the supply-demand balance in mid-2008 by slashing output from 32.35 million bbl/day in Q3 2008 to 31.16 in Q4 2008 and 28.5 million bbl/day through the first half of 2009.
The result was the oil market supply-demand balance began to tighten yet again starting in Q4 2008. By the second half of 2009, a rebound in global demand resulted in a deficit of 400,000 bbl/day in Q3 2009 and 500,000 bbl/day in Q4 2009 and a recovery in WTI to around $80/bbl by the end of that year.
The point is that it would take a severe hit to global oil demand in the second half of this year – something as bad as the hard-stop for the global economy in the second half of 2008 – to forestall a significant decline in global oil inventories through year-end.
Of course, nothing in global markets is impossible; despite Wall Street’s recent embrace of the “soft landing” narrative, I continue to see recession as the most likely end-result. However, it seems unlikely any global economic downturn would be powerful enough to cause the degree of demand destruction needed to balance the global oil market.
And, Saudi Arabia and OPEC have hinted they’re willing to consider deeper cuts if necessary to prevent a major increase in global inventories. Given OPEC’s increased power over global supply and prices right now, I see no reason to believe the cartel would not be willing to act to further support prices should demand hit a wall, just as they did in late 2008 and early 2009.
The recent break higher in oil prices appears to reflect the market’s growing confidence in further supply-demand tightening through at least the end of 2023.
DISCLAIMER: This article is not investment advice and represents the opinions of its author, Elliott Gue. The Free Market Speculator is NOT a securities broker/dealer or an investment advisor. You are responsible for your own investment decisions. All information contained in our newsletters and posts should be independently verified with the companies mentioned, and readers should always conduct their own research and due diligence and consider obtaining professional advice before making any investment decision.