

Some Answers to the Sentiment Puzzle
Some Answers to the Sentiment Puzzle
The market isn't climbing a Wall of Worry

One major issue I’ve been grappling with in this service since last summer is market sentiment.
Sentiment is a contrarian indicator. When investors are overwhelmingly bullish on stocks, bonds, oil or just about any other asset, there’s a strong tendency for the market to peak. That’s because committed bulls are, by definition, close to fully invested, leaving few investors, and little excess cash, to power the market higher.
Extreme bullish sentiment also tends to leave markets vulnerable to bad news on the economy or individual companies – any whiff of disappointment can prompt a wave of profit taking from bulls sitting on sizable paper market gains.
Of course, the opposite is true when prevailing market sentiment is bearish and most active investors have a pile of cash sitting on the sidelines that could be deployed into equity markets, sending stocks higher. After all, if most investors are already expecting bad news, the probability of a positive surprise is high.
Unfortunately, this logic and associated buy and sell decisions look cleaner on paper than in the real world due, in large part, to the difficulty in measuring sentiment. Two measures I watch are non-commercial commitments in the weekly Commitment of Traders (COT) release from the Commodity Futures Trading Commission and Bank of America’s monthly Global Fund Manager’s Survey.
Let’s start with the CFTC series:
Speculators in S&P 500 Futures are (Very) Bearish
For many years, the CME offered two different contracts on the S&P 500 – the full-sized S&P 500 futures and the E-Mini S&P 500 futures, the latter one-fifth the size of the big contract. Over time, the E-Minis became the dominant contract and the regular S&P 500 futures were finally retired outright in 2021.
So, I’ve reconstructed the data on Non-Commercial (speculator) positions in the S&P 500 since September 1999 in terms of E-Mini equivalent contracts:
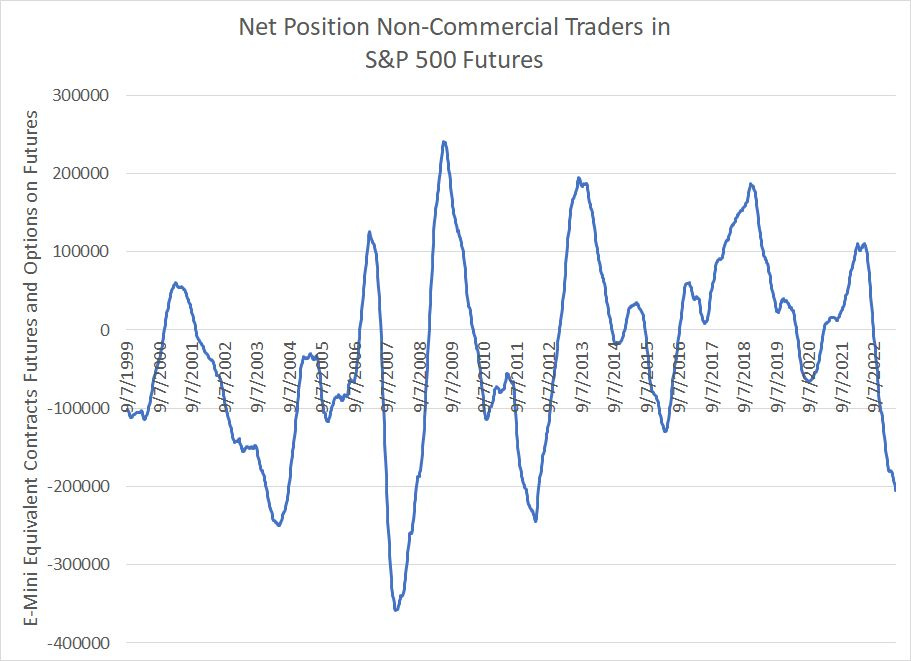
Source: Bloomberg
This is the raw data on net non-commercial futures and options positions on the S&P 500 since September 1999 – a negative number indicates speculators net short the S&P and a positive number net long. The current position, net short more than 205,000 contracts, represents the largest absolute net short in the S&P 500 in more than a decade (since April 2012).
Rather than look at the raw data, however, I like to transform this series into a z-score for cleaner signals:
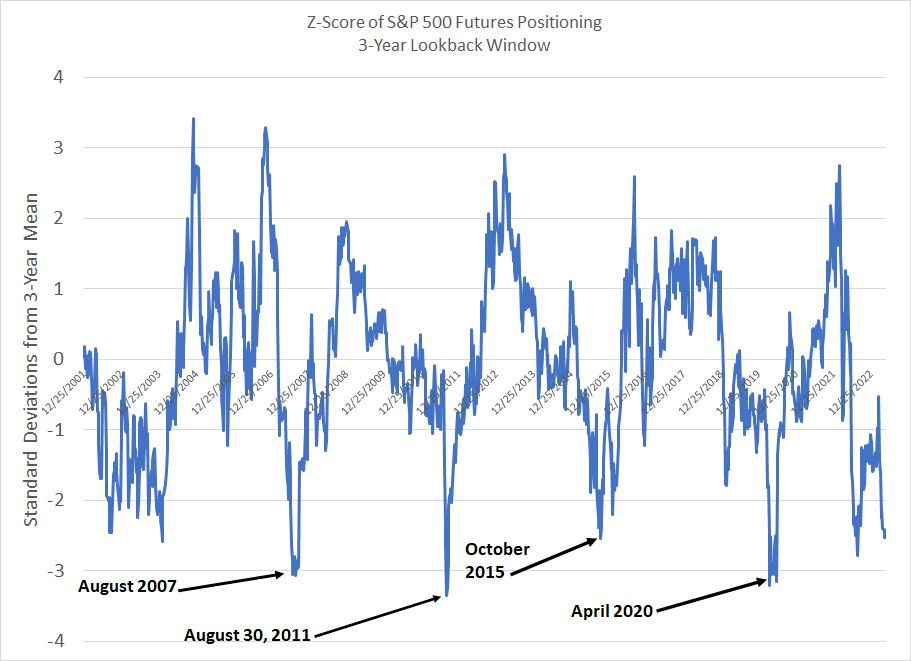
Source: Bloomberg
To create this chart, I looked at the average net non-commercial position in the S&P 500 over a trailing 156-week (3-year) lookback window and the standard deviations of weekly positioning over an equivalent period. So, a reading of negative 2.0 would suggest a speculative net short position that’s 2 standard deviations below the mean.
Currently, this indicator is sitting at -2.53. To put it mildly, I’d call that bearish sentiment toward the broader stock market.
I’ve labeled four setups since 2007 where speculative sentiment became very bearish on the stock market and 3 of the four also proved solid buying opportunities:
1. In April 2020, speculators held a more than -3.0 standard deviation net short position and this period proved to be the bottom of the COVID lockdown recession and bear market.
2. The market sold off in the summer of 2015, bounced into November 2015 and then logged a marginal new low in early February 2016. However, the S&P 500 never pulled back more than 7.6% from where it was trading in early October 2015 and ultimately stocks soared more than 26% through the end of 2017. I’d call that a successful signal.
3. The August 2011 signal came within 2% of the absolute low for the S&P 500 and the broader market jumped an impressive 93.9% from its 2011 lows to a peak in early 2015.
4. The August 2007 signal did mark a short-term bottom ahead of a rally to the ultimate cycle peak in October; however, this signal came just before the devastating Great Recession and bear market of 2007-09, which saw the index decline more than 50% from peak to trough. So, I’d call that a loss.
Bottom line: This indicator isn’t infallible, but looking at sentiment on this basis has provided useful signals in the past. That’s why I can’t dismiss the -2.8 standard deviation short position in S&P 500 futures we saw last August or the recent spike to a reading of -2.53 – it’s not normal for the stock market to see a major new leg to the downside with speculators already this bearish.
Even more puzzling, speculators have remained net short for most of this year despite a near 9% rally in the S&P 500 year-to-date through the May 18th highs. That’s more than 18.5% measured from the mid-October 2022 closing lows for the index.
It’s reasonable to wonder how traders can be so bearish with markets so far off the lows and the Nasdaq 100 – a proxy for the current growth darlings – up close to 27% this year.
Could this be the proverbial “Wall of Worry,” the foundation for every great bull market in modern financial history?
However, before we jump to conclusions, I’ve come around to two main explanations for this sentiment and market disconnect.
First, there’s a potential technical explanation. Index arbitrage is the practice of selling index futures and then buying baskets of stocks against that short position. The idea is to exploit short term deviations in the value of futures compared to index components. Alternatively, some hedge funds short S&P 500 futures and buy individual stocks; the idea here is to buy favored names while hedging away broader market risk.
Some of these strategies were widely deployed by major banks prior to the 2007-09 financial crisis, but banks have been backing away from these strategies as new regulations limit their activities. The problem is banks are classified as commercials while hedge funds are classified as non-commercials (speculators).
Thus, it’s possible that non-commercial CFTC position data today isn’t directly comparable to data in prior cycles due solely to the way CFTC classifies traders, changes in trading strategies deployed by major commercial banks and shifts in financial regulation.
Further, there are also futures contracts tracking the Nasdaq 100, Russell 2000 and Dow Jones Industrial Average. These markets are much smaller than the S&P 500, but we’re not seeing an equivalent net short position in any of these three markets – speculators are net long the Nasdaq 100 and have a net short position in the Russell of -0.82 standard deviations and -1.14 in Dow Futures both using the same 156-week lookback period.
It would seem rather illogical for traders to be so heavily short the S&P 500 while retaining much more modest short positions in the Dow and Russell, indices that have handily underperformed year-to-date and are widely regarded as more economically sensitive.
And that brings me to my second point:
The Crowded “Barbell”
Each month Bank of America (NYSE: BAC) publishes its Global Fund Manager Survey; between May 5th and May 11th, the bank surveyed 289 institutional investors with a total of $735 billion in assets under management.
At first blush this survey seems to confirm the bearish positioning in the CFTC data I just outlined. In particular, institutional investors remain defensive with a hefty cash position of 5.6% of assets (it’s unusual to see more than 5% in cash), a net 65% expecting a weaker global economy, and a net 14% overweight bonds over stocks, the highest proportion since March 2009.
Dig a little deeper, however, and there are some compelling counterpoints.
For example, almost two-thirds of investors surveyed think there will be a soft landing for the global economy with only a quarter looking for a hard landing (recession). Moreover, 30% of those surveyed believe the most crowded trade in markets today is long big technology stocks.
According to the May FMS, investors are net overweight a seemingly eclectic mix of cash, bonds, technology, growth and consumer staples – they’re long a barbell of growth stocks and defensive assets. Meanwhile, the same investors appear to be underweight, or dramatically reducing their exposure to, more cyclical assets like commodities, financials and value stocks.
In short, the puzzling bearish sentiment towards the broader market – usually a contrarian buy signal as I just outlined – appears related to the phenomenon of weakening market breadth we’ve seen since February. That’s something I’ve covered at some length in prior issues of The Free Market Speculator including “The Fab 5,” and “Party Like It’s 1999.”
The Big Growth Mega-Bubble
The reason market-cap weighted indices are outperforming their equal-weighted peers this year is down to significant outperformance from the 10 largest stocks in the Index.
Simply put, these 10 stocks account for a combined 2% weight in the S&P 500 EW Index, but almost 30% of the S&P 500 market-cap weighted index.
Just look at this:
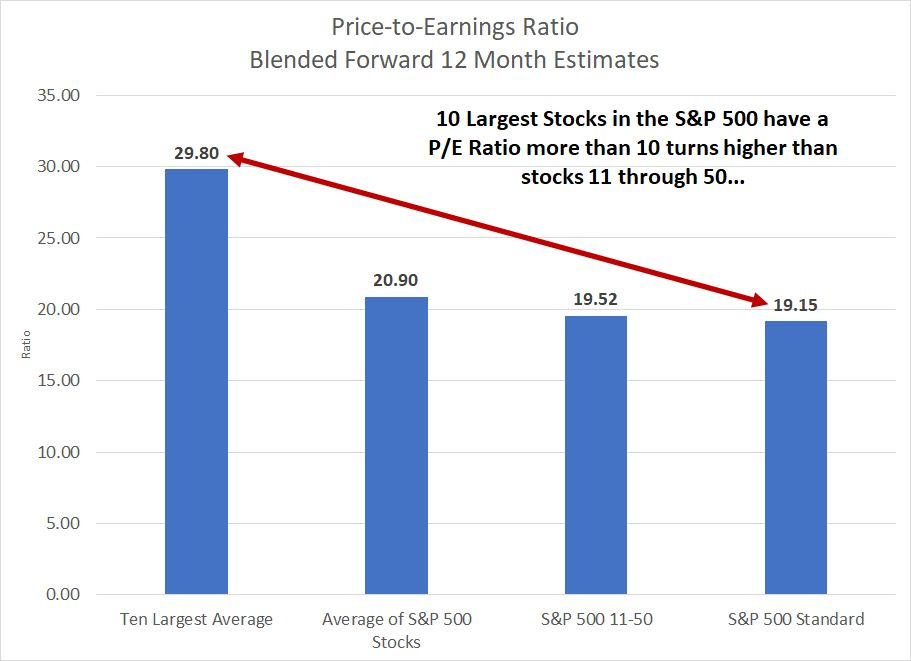
Source: Bloomberg
Hat tip goes to JP Morgan’s equity strategy team for pointing this out in a recent research report. The average forward price-to-earnings ratio for the 10 largest stocks in the S&P 500 is a whopping 29.8 times their blended forward 12-month earnings estimates (and that’s before today’s massive opening rally in NVIDIA).
That compares to an average P/E of just 19.52 times for the next 40 stocks in the index ranked by market capitalization, more than 10 turns lower in terms of valuation.
Simply put, there’s a ton of optimism – investors are very bullish – on a handful of large cap stocks in the US. Going beyond that rarified tier of mega-caps, valuations and investor sentiment are far more restrained.
Thus, the contrarian trade right now is NOT long stocks against a huge speculative net short position in the S&P 500, it’s likely bearish the mega-cap market leaders and more constructive on badly battered cyclical value issues. And, since the mega cap growth leaders comprise such a dominant share in the S&P 500, such a contrarian move would be bearish for the broader market as a whole.
However, while that might be a valid contrarian trade longer term, investors should remain selective at this time because long value, short growth is the EXACT opposite of what works as the economy tips into recession.
Despite strength in the headline indices, so far this year markets are actually trading as you’d expect just before or after the start of US recession:
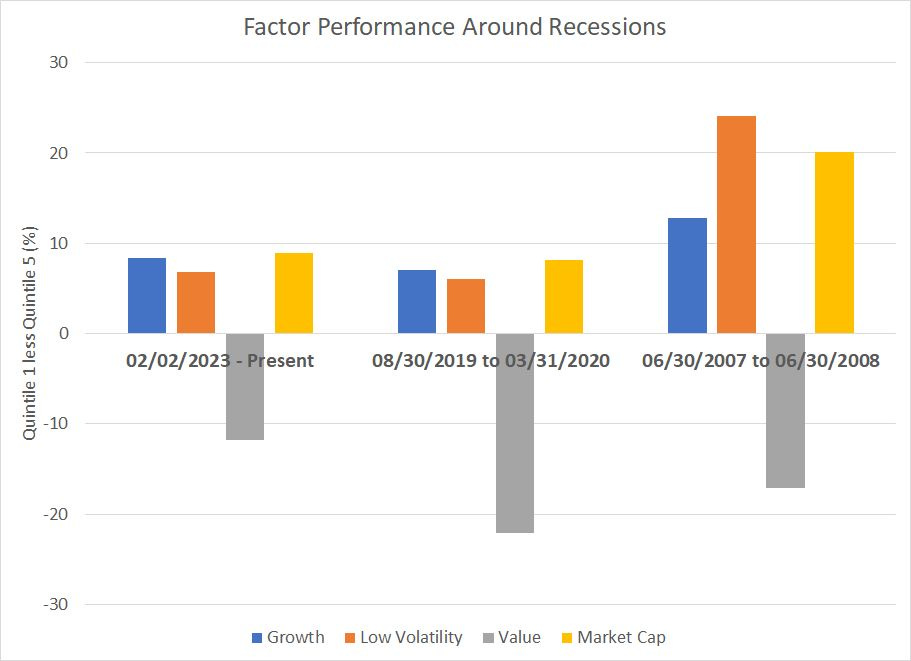
Source: Bloomberg
A “factor” is a fundamental or technical characteristic. For example, the value factor uses metrics like the price-to-earnings ratio to rank stocks by valuation and the momentum factor might rank stocks by their performance over a trailing one-year period.
My chart above uses Bloomberg-defined factors to divide stocks in the Russell 1000 Index – a broader large-cap index than the S&P 500 – on 4 key factors.
There’s growth, which uses trailing and expected forward earnings growth estimates to rank stocks, value which uses earnings yield (the inverse of the P/E ratio) to rank stocks by valuation, firm size which ranks stocks by market cap and low volatility based on a stock’s relative price volatility compared to the market as a whole.
For each factor, stocks in the Russell 1000 are ranked by quintile with the top 20% of stocks with the lowest valuation, for example, ranking in Quintile 1 on the value factor and the most expensive stocks in Quintile 5. Then, for the 3 time periods listed, I’ve displayed the return from buying Quintile 1 and shorting Quintile 5.
The time periods I’ve chosen here include the period since February 2nd this year, as well as the latter stages of recent bull markets and the early stages of the subsequent bear market and economic recession periods. The pattern is clear and consistent.
The size factor outperforms prior to and during the early stages of a recession and bear market. The reason is investors tend to circle the proverbial wagons around large-cap stocks and abandon more economically cyclical small caps when there are concerns about the economy.
The low volatility factor also tends to outperform. That makes sense because when there are concerns about market downside, investors are likely to crowd into the stocks with the least price volatility that are perceived as most defensive. The consumer staples sector of the S&P 500 is a classic example – this sector is comprised of stocks in industries like food, beverage and grocery retailing.
Over the past 5 years, the beta for Consumer Staples is about 0.65 where indices with a beta less than 1.0 are less volatile than the S&P 500. And since February 2nd this year, Consumer Staples rank 3rd out of 11 S&P 500 economic sectors indices in terms of total returns, trailing only Technology and Communications Services.
The next two may seem a bit counterintuitive to some readers. Growth stocks tend to outperform through the early stages of an economic downturn and bear market mainly because these companies can usually continue to show some earnings growth, or earnings resilience, as the economy slows. Value stocks, in contrast, tend to hail from more cyclical industry groups like energy, financials and industrials, so their earnings tend to get hit harder when the economy sours.
What you can see in my chart above is that the current disposition of these 4 key factors is broadly similar to the other two periods I’ve outlined around the 2020 recession and the 2007-09 Great Recession.
Paradoxically, the market’s strength over the past 3 to 4 months reflects growing concerns about economic weakness and potential recession. Because a small number of mega-cap growth stocks have such a hefty weight in the S&P 500, growth factor outperformance, typical ahead of recessions, is propping up the broader indices even as there’s significant weakness just beneath the surface.
There are two points to note.
First, these are relative returns, not absolute returns. If growth quintile 1 rallies 10% and growth quintile 5 is flat, the growth bar on my chart would show up as +10%. However, if growth quintile 1 were to sell off by 20% and quintile 5 were to drop 30%, this would still show up as +10%; just because a factor screens well doesn’t mean the strongest growth stocks are rallying, just that they’re outperforming stocks with weaker factor profiles.
Indeed, look back at a market like 2007-09 and you’ll see that growth stocks didn’t rally after the bear market started, though these stocks outperformed many value and cyclical industry groups like financials. Ultimately, of course, as we approach the “sell everything” moment of a bear market, almost all stocks get hit as a herd.
Second, these time periods are not of equal length. For the current period, I am only looking at relative factor returns since February 2nd, less than 4 months ago, compared to a 1-year period around the 2007-09 Great Recession and 7 months around the 2020 downturn. Thus, the degree of growth outperformance over a period of less than 3 months is impressive.
DISCLAIMER: This article is not investment advice and represents the opinions of its author, Elliott Gue. The Free Market Speculator is NOT a securities broker/dealer or an investment advisor. You are responsible for your own investment decisions. All information contained in our newsletters and posts should be independently verified with the companies mentioned, and readers should always conduct their own research and due diligence and consider obtaining professional advice before making any investment decision.