


Stagflation and the Coming Lost Decade
Plus: What it means for your portfolio

The term stagflation is loosely defined as a combination of restrained economic growth and high inflation.
For most investors it’s closely associated with the 1970’s and a “lost decade” for stocks.
However, the term stagflation, at least as it applies to the 1970’s is a misnomer:
Source: Bloomberg
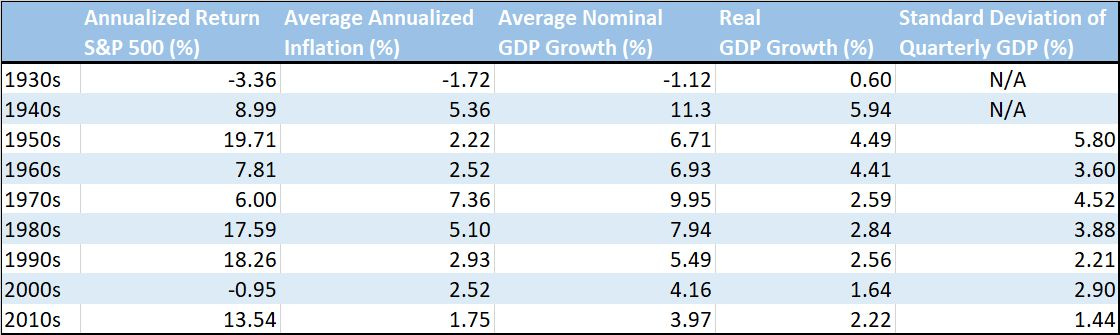
You’ve probably heard or read that stocks always make money over the long haul, but that really depends on what you consider to be long-term. In the past century, there have been three lost decades for the US stock market – the 1930s (Great Depression), the 1970s and the 2000s.
In the 1930s, the S&P 500 declined 3.36% on an annualized basis.
While there was deflation – the purchasing power of money increased through the 1930s – even adjusting for that, the real return on stocks was negative. As you might expect, the ‘30s is the only decade in the past century where nominal Gross Domestic Product (GDP) declined outright, falling at a 1.12% annualized rate.
Between 1999 and 2009, the S&P 500 also declined at a rate of -0.95% annualized and if we factor in averaged annualized inflation of around 2.5%, the real return on stocks was even worse. Economic growth in the 2000s was 4.16% annualized on a nominal basis or about 1.64% if we account for inflation, the worst showing since the 1930s in real terms.
In the 1970s, stock market returns were positive on an absolute basis at 6% annualized but when you factor in the roughly 7.4% annualized increase in prices (inflation), your real return from the stock market was negative.
Yet, economic growth in the 1970s – the “stag” part of stagflation -- wasn’t as weak as you might suppose, or as what’s implied by the term itself.
Indeed, at about +2.59% annualized, real US economic growth in the 1970s was in-line with the 1990s, a decade that’s often remembered as a sort of Golden Age for the US economy and stock market.
However, while real economic growth was similar in the 1970s and 1990s, the real total return from stocks was negative in the 1970s while the 1990s represented the best decade for the broader market since the 1950s.
The big difference between the 1970s and the 1990s was the degree of economic “volatility” and the duration of economic cycles.
In the table above, I’ve included a column that measures the standard deviation of quarterly real GDP growth through the decade – the higher the number, the wider the variability in economic growth. Put another way, you could say a higher standard deviation of economic growth implies a more unpredictable business environment.
Here’s the key difference: As you can see, the standard deviation of quarterly real GDP growth in the 70’s was more than twice that of the 1990s.
Also, between December 1969 and November 1982, a period of about 13 years, there were a total of four US recessions and the economy was in recession for a total of 49 months.
In other words, the US was in recession in almost one-third of all months over this time.
In contrast, between November 1982 and the end of 2000, a period of 18 years (216 months), the US endured only one (mild) recession and was in recession for only 8 months (3.7% of months).
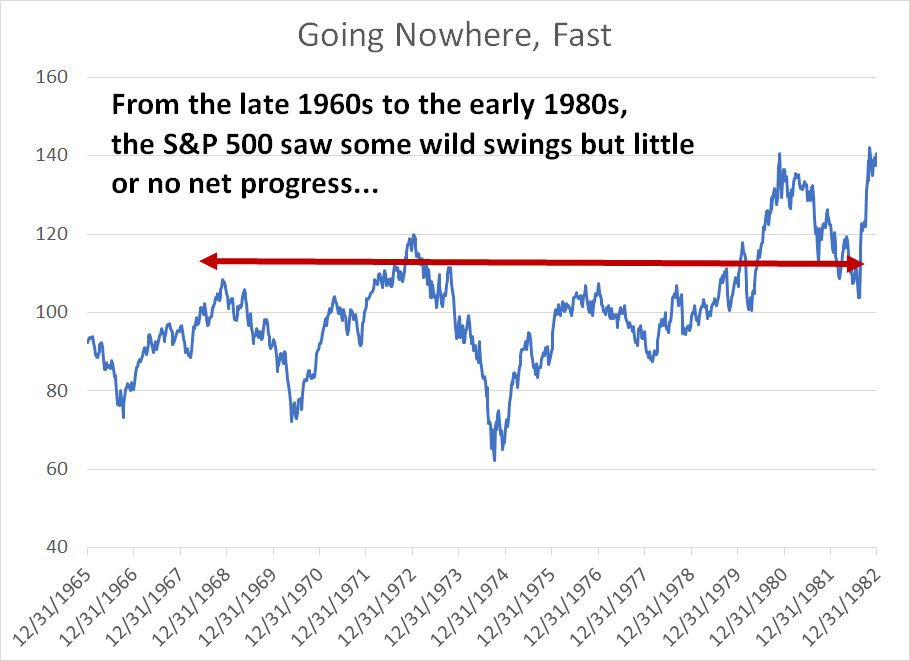
So, what does a lost decade (more accurately lost 14 years) look like for the S&P 500:
Source: Bloomberg
A lost decade for the stock market is NOT the same thing as a bear market.
As you can see from my chart above, the big swings in economic conditions and inflation, starting in the late 1960s and lasting until the early 1980s, catalyzed some wild moves in the S&P 500 including dramatic bull markets from 1970 to 1972 and a vicious bear market from 1973 to 1975.
Buying and holding the broader market (S&P 500) resulted in negative returns when adjusted for inflation even including dividends.
I’m Looking for Another Lost Decade
Myriad factors led to stagflation and a lost decade for the S&P 500 through the 1970s. Unfortunately, many of the same basic issues plague markets today.
Commodity prices and oil, in particular, jumped in the 1970s. The proximate cause was the Organization of Petroleum Exporting Countries (OPEC) began flexing its muscles in the early 70’s, restricting growth in global oil supply even as global demand continued to rise.
The bigger problem was that the US, and other western powers, had grown too reliant on energy imports from OPEC, giving the cartel outsized influence to control supply and prices. The 70’s oil supercyclic didn’t end until higher global investment in exploration and development of new oil and gas reserves finally resulted in a surge in non-OPEC production in the late 1970’s and early 1980’s.
As I explain in the October 8, 2022 issue of FMS, “Why Oil Supercycles End,” global capital spending (CAPEX) on development of new crude oil projects has dried up over the past 9 years and remained low despite the surge in prices since mid-2020. While recessions can bring down oil demand and prices temporarily, supply is insufficient to meet demand in a normal economic environment.
The only cure for high oil prices is sustained high oil prices that incentive a new spending cycle in energy. And commodity supply is sticky, so it will take a few years of elevated CAPEX to result in significant new supply.
The bad news: The energy CAPEX cycle hasn’t even started yet due, in part, to misplaced optimism about the near-term prospects for alternative energy to supplant fossil fuels.
Stop-Go Economics
Looking beyond commodity price inflation, a second driver of elevated inflation in the 1970s was the so-called “Stop-Go” economic and monetary policy environment.
As I explained in the January 24, 2023 issue of FMS, “Yield Curves, Recessions and Bear Markets,” the Fed tightened policy rates dramatically in 1973-74 in an effort to bring down runaway inflation. The result was a deeply inverted yield curve and a deep and protracted recession.
Growing economic pain eventually prompted the central bank to loosen policy in the fall of 1974. The nasty bear market of 1973-74 ended in November 1974 and the economy exited recession in March 1975; however, the embers of inflation were still glowing and consumers’ inflation expectations had become entrenched.
The result: A new highs in year-over-year inflation rates by 1980.
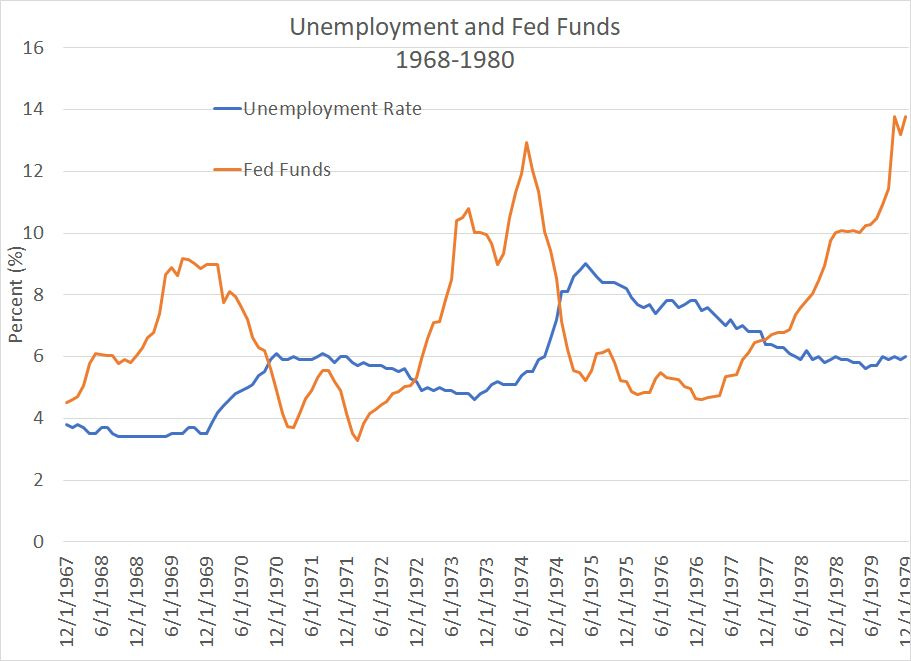
Take a look at this chart of the Fed Funds rate and unemployment from the late 1960s to 1980:
Source: Bloomberg
As you can see, unemployment was low in the late 1960s (sub 4%, much like today) and, as inflation began to rise, the Fed hiked rates into early 1970. The resulting recession caused the unemployment rate to jump to 6%, so the Fed cut rates in late 1970 and into early 1971.
While the economy exited recession in late 1970 and unemployment came down, the Fed maintained low rates through 1972 even when it was clear inflation was picking up steam.
That led to the 1973-75 recession and the rate cycle I outlined earlier.
Once again from 1975 to 1977 the Fed maintained low rates even though inflation remained stubbornly high through much of the period. The central bank appeared reluctant to tighten partly because while growth recovered, the unemployment rate remained elevated; unemployment didn’t fall below 7% until late 1977 compared to sub-4% in the late 1960s.
In other words, from the late 1960s until the early 1980s, the Fed was torn between slamming on the brakes to combat inflation and slamming the accelerator to address weaker growth and higher unemployment. The result was “Stop-Go” for the economy and the volatile “stagflation” environment.
All of this had its roots in easy money and fiscal expansion — the Great Society spending under President Johnson — in the late 1960’s.
Of course, the federal government’s fiscal largesse amid COVID lockdowns is unparalleled except for a brief period in the early 1940s as the government ramped up military spending during World War II.
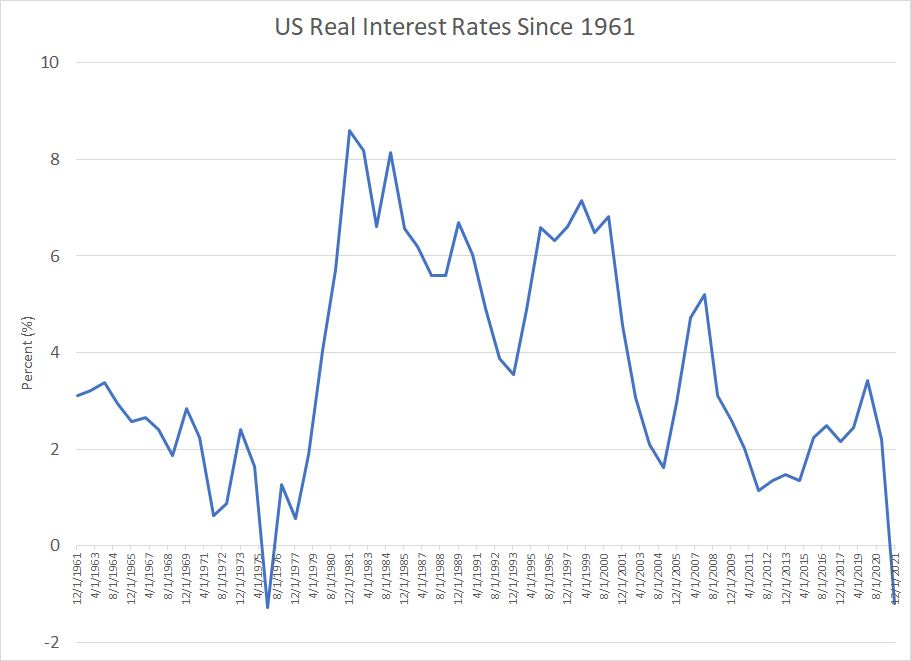
And take a look at US real interest rates:
Source: Bloomberg
The Fed drove real interest rates — interest rates adjusted for inflation — into negative territory following COVID in 2020. And, rates have generally been low since the Great Recession and financial crisis of 2007-09.
As you can see, the only other time in US history where real rates have been this low was the late 1960’s, through most of the 1970’s.
Is it really any wonder inflation is acting as it did 50 years ago?
I also see seeds of the Stop-Go policy response once again. While Fed Chairman Jerome Powell has been talking (and acting) tough on rates for over a year now, so did then-Chair Arthur Burns in the 1973-1974 period.
Yet, the US hasn’t yet faced the economic pain that characterized 1974 and, until SVB Financial blew up last week there were few signs of crisis. I suspect that just as Powell was quick to create a new program to support regional banks last weekend, he’ll cut rates as soon as the economy is clearly slipping into recession and as unemployment begins to rise.
Yes, inflation will likely come down as the US enters recession — just as it did in the 1974-75 period. However, there’s real risk inflation will remain elevated and surge again once the economy recovers, just as it did in the mid and late 70’s.
Indeed, as the fiscal and monetary stimulus applied in the 2020-21 era is orders of magnitude higher than anything we saw in the late 60’s and early 70’s, inflation may be even more intractable that it was back then.
Market Valuations Need to Come Down
Unfortunately, as I explained in the January 5, 2023 issue of FMS “The Most Powerful Indicator of Long-Term Market Returns,” even after the sell-off since early last year the S&P 500 remains expensive b y any historic yardstick and far more expensive than it was in the late ‘60s boom years:
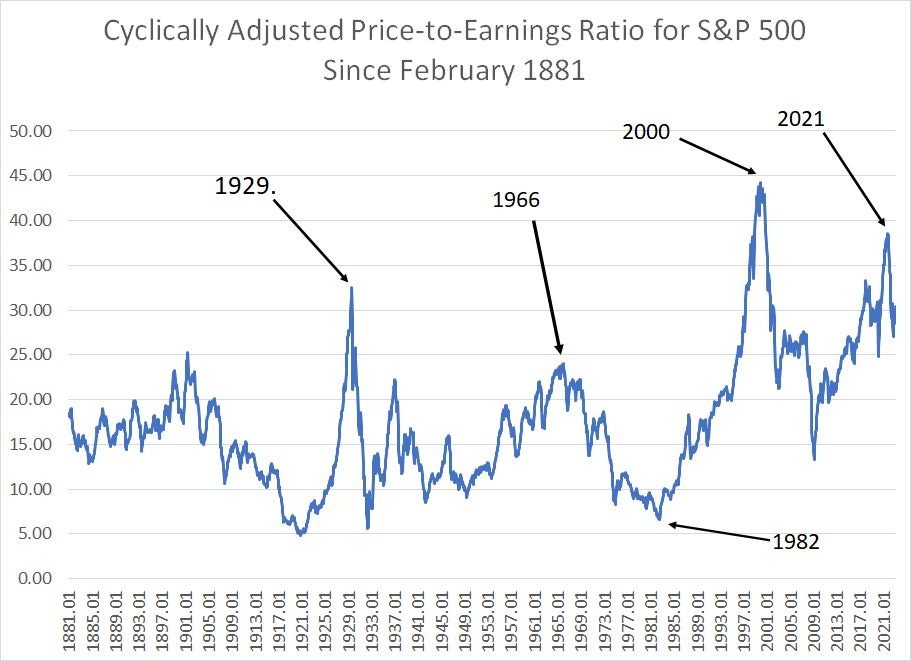
Source: Professor Robert Shiller, Yale University
Professor Robert Shiller at yale University has calculated a Cyclically Adjusted Price to Earnings (CAPE) ratio back to early 1881.
As you can see, the market traded at an elevated valuation in the mid to late 1960s; stagflation in the 1970s saw valuations since to the lowest levels since the Great Depression years by late 1982. Buying stocks cheap worked like a charm as 1982 was the start of an historic bull market that didn’t end until 2000.
Today, valuations are just off their 2021 peak and remain even more elevated than they were at the top of the mid-60’s boom years.
Inflation and stagflation brought down overall market valuations in the 70s and I suspect we’re in for a similar adjustment in coming years.
How to Profit Amid Stagflation
Of course none of these trends paint a particularly encouraging outlook for investors.
Indeed, In continue to expect many of the popular strategies of the past two decades — passive indexing to the S&P 500 and target maturity funds — to continue to come under pressure in coming years as inflation is poison for both equity market valuations and real returns from fixed income.
However, not all investors lost money in the 70’s. I’ll leave specifics to future issues of FMS, but broadly there are two ways to make money in a market like the 1970s:
You can trade the swings in the market. Take a look at my chart of the 1968 to 1982 S&P 500 and you’ll see that while the market went nowhere over this time, there were powerful multi-year bull markets and bear markets along the way that could be quite profitable for investors.
Some sectors and asset classes performed well in the 70’s including commodities like oil, gold and related producers. While these stocks and commodities did see corrections along the way — such as we’re seeing in energy right now — those pullbacks proved buying opportunities.
DISCLAIMER: This article is not investment advice and represents the opinions of its author, Elliott Gue. The Free Market Speculator is NOT a securities broker/dealer or an investment advisor. You are responsible for your own investment decisions. All information contained in our newsletters and posts should be independently verified with the companies mentioned, and readers should always conduct their own research and due diligence and consider obtaining professional advice before making any investment decision.