


“Stealth Easing” and Bank Reserves
Watch the Fed's balance sheet, not what they say...

Stocks saw a powerful rally in the month of November with the S&P up a touch over 9.1%, the Russell 2000 up a little over 9% and the Nasdaq 100 up a whopping 10.9%.
Out of the 11 Economic Sector Indices only one, the S&P 500 Energy Index, managed to produce a negative total return last month and that decline was only around 1%.
The rally-in-everything also extended beyond ebullient equities to the fixed income market with the iShares 20+ Year Treasury ETF (NYSE: TLT) soaring 9.6%, the iShares 7-10 Year Treasury ETF (NYSE: IEF) up 4.6%, the iShares iBoxx Investment Grade Corporate Bond Index up 7.6% and the iShares High-Yield Corporate Bond ETF (NYSE: HYG) “junk bonds” up 4.9% last month.
Some segments of the market are looking extended from a trading perspective, particularly the Nasdaq 100. However, we remain in a seasonally strong period and overbought readings on indicators like RSI have tended to result in only modest pullbacks or periods of consolidation this year rather than major downside momentum.
Moreover, I’m just not seeing many signs of stress in credit markets right now.
I’ve written about the Fed’s balance sheet on multiple occasions this year, most recently in the November 21, 2023 post “Treasury’s “Payday” Loan Problem.” I know it’s not exactly the most fascinating topic and, at first blush, it might seem esoteric or downright impractical. However, a closer examination reveals a strong relationship between equity market returns and changes in weekly bank reserves.
Here's a quick refresher for new readers or anyone who might have fallen asleep the last time I wrote about this. Consider the following line items on the Fed’s balance sheet:
The Treasury General Account (TGA) is the federal government’s checking account at the central bank, and it appears as a liability on the Fed’s balance sheet in much the same way your checking account deposits appear as a liability on the balance sheet at your local bank.
As of last week, the Treasury had around $740 billion in the TGA. Before the debt ceiling deal in early June, the TGA had dwindled to well under $50 billion:
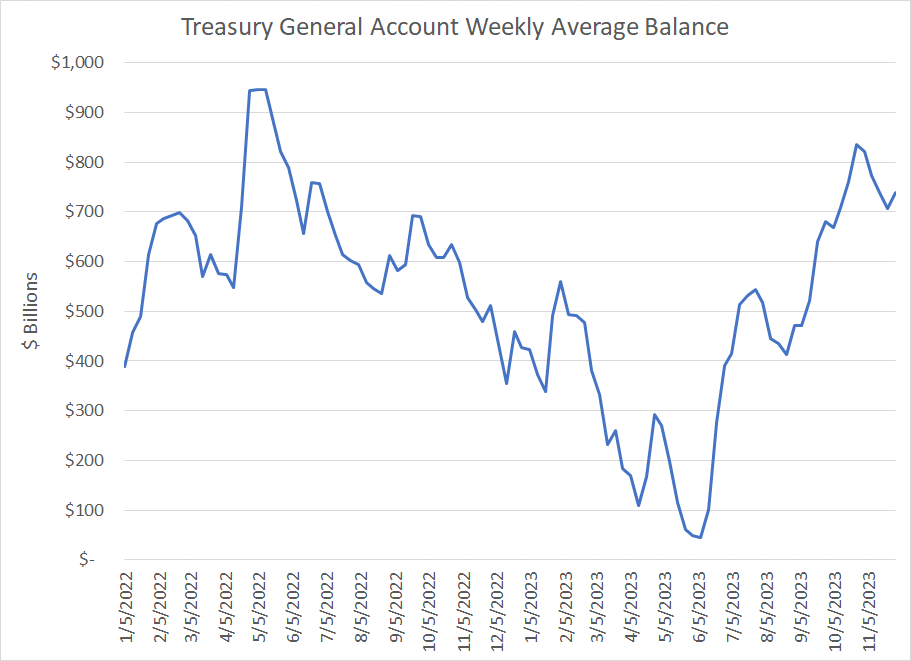
Source: Bloomberg, Federal Reserve H.4.1
Note that the figures in my chart above represent the weekly average balance in TGA; as I explained in “Follow the Money,” TGA actually hit lows of $23.368 billion on June 2nd of this year.
As you can see, since June 2nd Treasury has been on a borrowing binge of epic proportions, restoring the TGA to more normal levels we saw back in 2022.
The Reverse Repo (RRP) facility allows institutions to place money with the Fed on a short-term basis and earn a risk-free yield on their cash — on Friday December 1st, for example, RRP offered a yield of around 5.3% annualized .
Most of the money in RRP represents money market fund assets and RRP also appears as a liability on the Fed’s balance sheet.
There was about $1.25 trillion in the RRP as of the close of business last Wednesday November 29th:
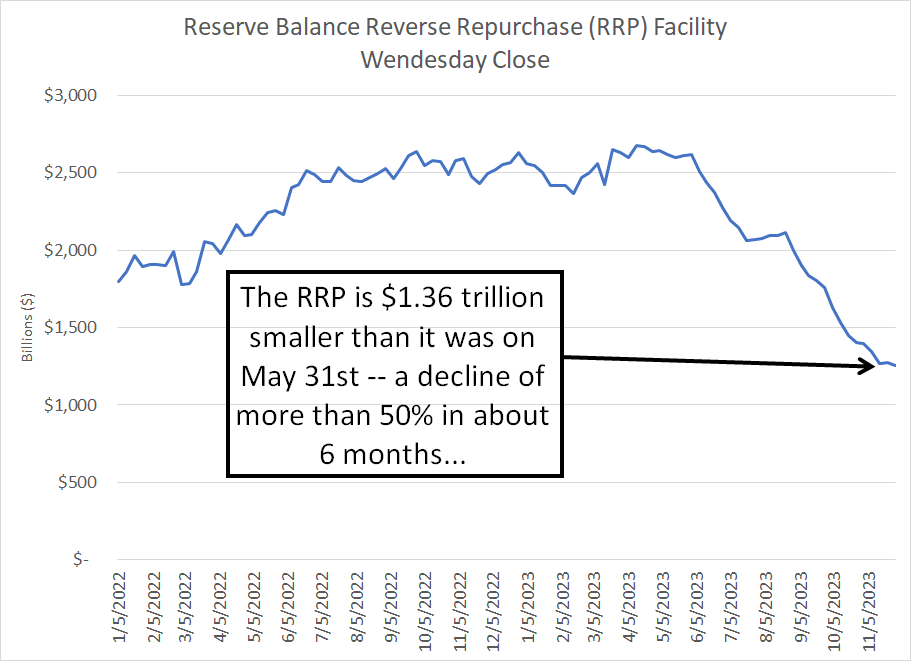
Source: Bloomberg, Federal Reserve H.4
Since May 31st, the RRP has drained by more than $1.36 trillion. As I explained in my November 21st post, that’s mainly a function of money market funds withdrawing cash from RRP to buy Treasury Bills, which have offered a higher yield than RRP since June’s debt ceiling deal.
Securities Held Outright represent Treasuries and mortgage-backed securities (MBS) the Federal Reserve holds as an asset on its balance sheet. When the central bank performs quantitative easing (QE), it’s buying Treasuries and MBS, which will result in a steady increase in the size of this line item.
Of course, when the Fed is undertaking quantitative tightening (QT), the opposite is true – securities held outright will decline over time.
The Federal Reserve holds more than $4.8 trillion worth of Treasury Bonds and $2.45 trillion worth of MBS on its balance sheet right now. This represents (by far) the largest asset on the Fed’s balance sheet:
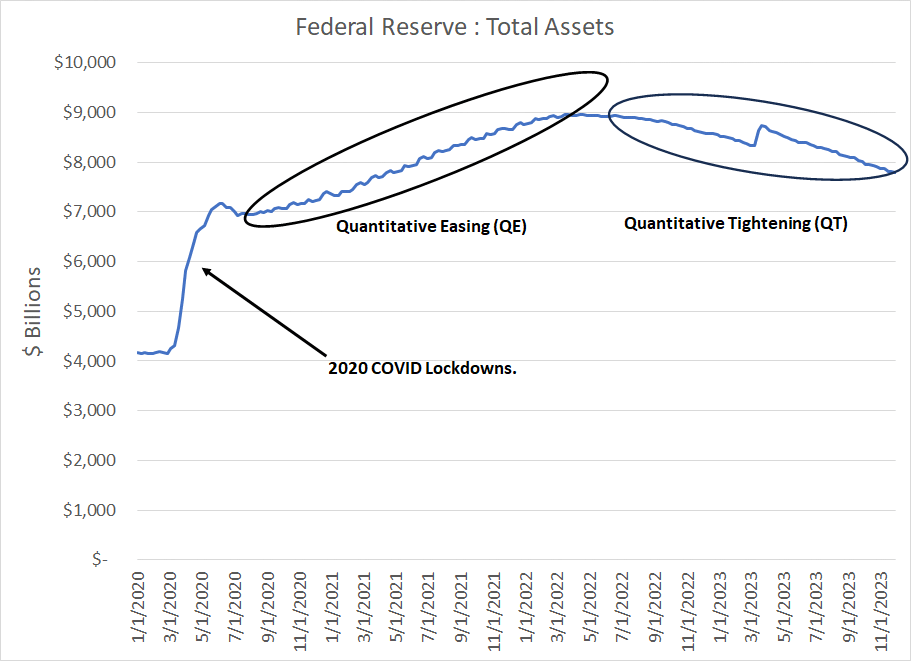
Source: Bloomberg, Federal Reserve H.4
I took this chart back to 2020, so you can see the conduct of Fed policy over a bit longer time frame. You can clearly see the vertical surge in Fed assets back in early 2020 amid COVID lockdowns, following by a steady rise in assets through early 2022 (QE).
Since early last year, quantitative tightening has resulted in a steady decline in Fed assets interrupted only by a brief pop to the upside in the spring of this year. That jump is a result of the creation of the Bank Term Funding Program (BTFP) used to bail out the regional banking sector. Simply put, BTFP allows banks to borrow money from the central bank, posting collateral in the form of Treasuries.
The current balance of loans under BTFP is just shy of $114 billion; since these represent loans made by the central bank, they appear as an asset on the balance sheet. While that’s a considerable sum of course, it’s not much in comparison to the Fed’s $7.8+ trillion balance sheet.
Finally, Bank Reserves represent money commercial banks hold at the Fed and they appear over on the liability side of the Fed’s balance sheet.
Of course, there are far more line items on the Fed’s balance sheet that these four – you can see all of them on the Fed’s website every Thursday at around 4:30 PM Eastern Time as part of the Fed’s H4 release. However, these are four of the most important, and largest, line items to watch.
The bottom line is the Fed’s Balance Sheet must balance: A decline in the asset side of the ledger must be counterbalanced either by an increase in other assets held by the central bank or a decline on the liabilities side.
So, under QT, there’s been a steady decline in the asset side of the Fed’s balance sheet because of the fall in securities held outright by the central bank – from a peak on June 8, 2022, total holdings of US Treasuries are down about $928 billion while MBS holdings are down some $283 billion from a peak in late March 2022.
From highs on April 13, 2022 the total assets on the Fed’s balance sheet are down almost $1.17 trillion; QT has been the major driver of falling Fed assets with the decline in Treasury and MBS securities held outright offset only slightly by other asset line items (like BTFP as I just explained).
So, the key question to ask when it comes to QT is this:
Which liability line items fall to balance the decline on the asset side of the central bank’s balance sheet?
The answer to this question tells you more – MUCH more – about the actual stance of Fed policy than any speeches by Jerome Powell or other FOMC members. Indeed, it’s more important than the change in the yield on 10-Year Treasuries or other factors discussed ad nauseum in the mainstream financial media.
I covered this topic just last week in “Rate Cuts, Goldilocks Now and the Dollar’s Smile,” so I won’t wade back into a full rundown of all the moving parts. Suffice it to say that Treasury (the federal government) has issued an avalanche of Treasury Bills (short term debt) to fund the deficit and replenish TGA.
Money market funds have simply moved money from RRP to T-Bills, so the decline in RRP has done ALL of the heavy lifting in terms of absorbing QT on the Fed’s balance sheet.
As a result, bank reserves at the Fed, which represent the lifeblood of the US economy, have actually risen this year to the highest levels since the spring of 2022 despite the rise in TGA since May and the ongoing, steady conduct of QT.
The key point is this represents a sort of “stealth easing” by the Fed that few are talking about amid all the noise about whether or not the Fed will hike an additional 25 basis points, how much the central bank may cut rates next year, or whether rates will remain “higher for longer.”
And that brings me to this:
Bank Reserves and Market Returns
Let’s take a closer look at the relationship between bank reserves and S&P 500 market returns.
Specifically, I examined the 4-week percentage change in bank reserves on the Fed’s balance sheet compared to contemporaneous 4-week percentage changes in the price level of the S&P 500.
Take a look:
Source: Bloomberg
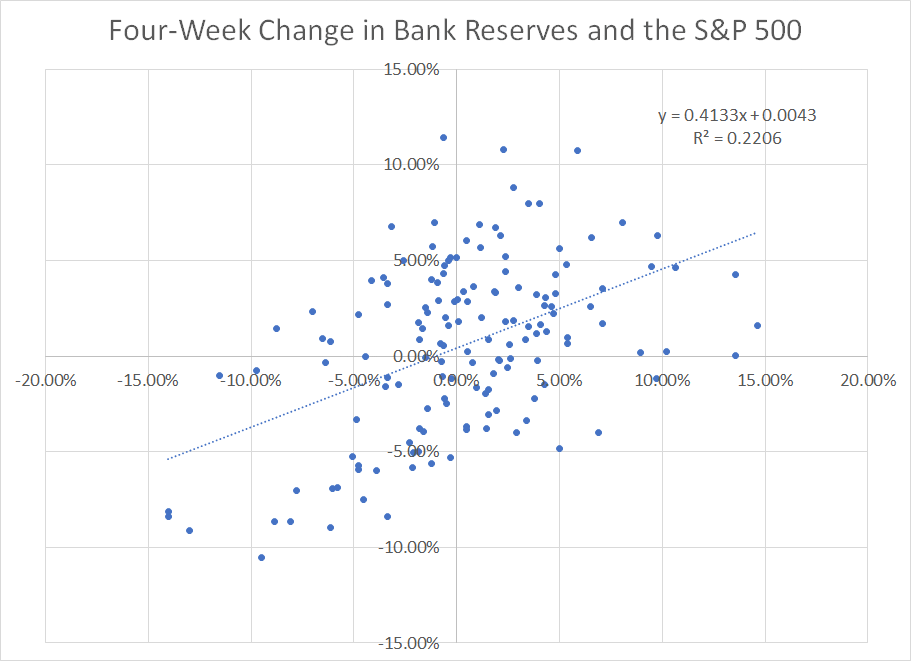
This scatterplot shows the 4-week change in the S&P 500 on the y-axis (vertical axis) compared to the four week change in reserves on the x-axis (horizontal axis).
As you can see, there’s a clear positive relationship here – when bank reserves in the Federal Reserve System rise that tends to correspond to strong equity market performance and vice-versa.
The R-squared (coefficient of determination) value of the trendline I’ve drawn on the chart is a little over 0.22, which suggests changes in bank reserves “explain” about 22% of stock market performance since early 2021. That’s not high in absolute terms; however, R-squared values are notoriously low on regressions of financial variables and it’s high enough to imply a meaningful and useful relationship.
Given that clear relationship between bank reserves, credit conditions and stocks, I wondered whether changes in bank reserves might carry some useful information about future stock market returns.
In particular, I decided to examine whether an unusually large jump in bank reserves over a 5-week period might imply elevated returns over the subsequent 5-week holding period.
To define “unusually large” I looked at the standard deviation of 5-week changes in bank reserves over a 26-week lookback period (6 months) – if changes in bank reserves were more than 1 standard deviation above the mean, I considered that a large rise in reserves; vice-versa for a 1 standard deviation decline in bank reserves.
Take a look:
Source: Bloomberg
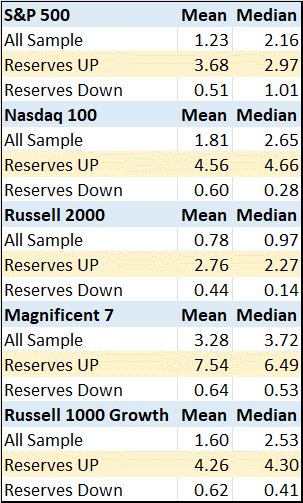
I examined bank reserve data and equity market returns using 5 widely followed broader stock market indices since early 2017.
The results are encouraging. The average rolling 5-week return from the S&P 500 over this period was 1.23%; however, following a greater than 1 standard deviation surge in bank reserves, the index returned an average of 3.68% over the subsequent 5 weeks.
And, when bank reserves fell more than 1 standard deviation, the subsequent 5-week return was just over 0.5%, significantly below the sample average.
What’s even more telling in my view is the same performance data for the Nasdaq 100, the Bloomberg Magnificent 7 Index and the Russell 1000 Growth Index. Theoretically, tightening credit conditions and rising interest rates should have the most profound impact on growth stocks, which rely on distant future earnings to support their current (elevated) valuations.
That appears to be the case.
For example, on average, the 5-week return for the Nasdaq 100 over this period was about 1.81%; yet the 5-week return following a surge in bank reserves was a whopping 4.56%.
For the Magnificent 7 group of technology and growth stocks – responsible for the lion’s share of stock market gains in 2023 – the average 5-week return was 3.28% compared to 7.54% after a reserve surge and just 0.64% after a fall in bank reserves.
So, if you’re wondering how 7 stocks can be up 100% in 2023, carrying the entire S&P 500, despite nosebleed valuations and some rather uninspiring earnings results in Q3, I think this is at least a partial answer. Despite all the bluster, bank reserves suggest Fed policy has been a good deal easier this year than it might first appear. That’s benefited exactly the long duration growth stocks you’d expect to outperform in such an environment.
This simple “indicator” has offered useful signals so far in 2023, particularly flagging potential rallies:
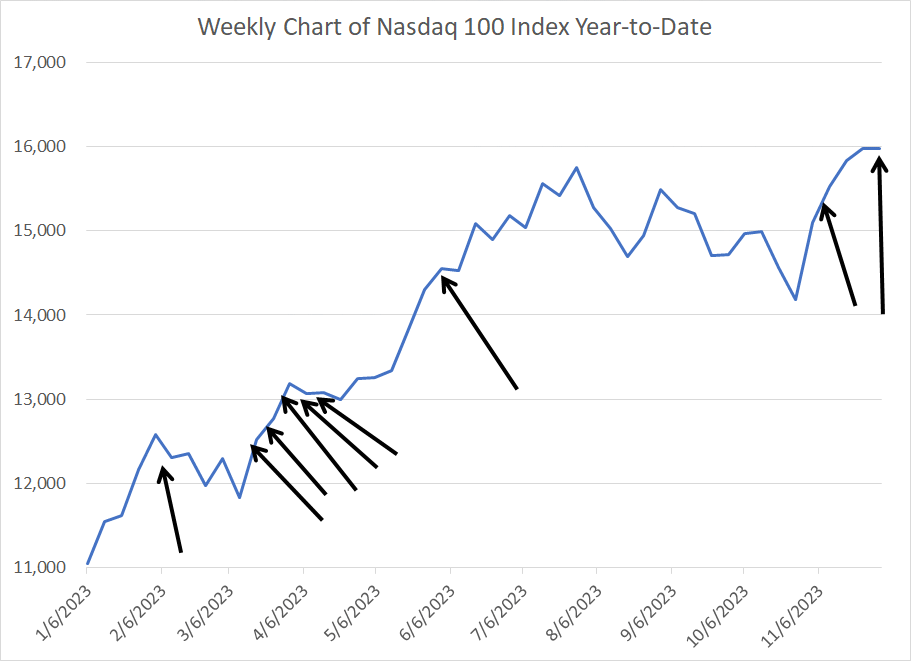
Source: Bloomberg
This chart shows the Nasdaq 100 year-to-date; each black arrow signals a reserve surge on the basis I just outlined. As you can see, this signal has tended to trigger just after a market low and the bottom of a correction.
I see a few, key takeaways from all this:
Watching the interplay of RRP, TGA and bank reserves is more than just a theoretical exercise, it can flag instances where a rising tide of liquidity will boost stocks, particularly tech and growth stocks.
There’s been a sizable surge in bank reserves since early October with reserves rising sharply even as most talking heads were talking about soaring bonds yields and higher-for-longer rates. That “stealth loosening” in credit conditions did, however, boost the market in November with the market seeing one of its best months in years.
This indicator has signaled again last week, suggesting that while we can’t rule out a correction, bank reserves remain a tailwind for stocks for now.
Longer term, I can see this Goldilocks outcome persisting for some time as there remains more than $1.25 trillion in the RRP facility. At the recent pace of dissipation, however, the RRP would be exhausted by roughly Q2 2024 and then it will be tougher for Treasury to continue funding itself using T-Bills without some sort of impact on bank reserves because the honey pot of money market fund assets will be exhausted.
If and when we do see a more meaningful decline in bank reserves, there’s clear downside risk to stocks as well as the potential for credit conditions to tighten suddenly and in non-linear fashion, leading to a hard stop for the US economy.
Thank you to all those who have signed up for a free trial to the paid tier of FMS over the past week.
If you’re interested in a 90-day Free trial to the paid tier of The Free Market Speculator, please tap the button below:
Paid readers receive bonus posts and content as well as access to the FMS model portfolio of stock and ETF recommendations that’s updated at least twice per month. I’ll also be giving paid tier readers access to special reports and e-books I’ll be releasing in coming weeks.
DISCLAIMER: This article is not investment advice and represents the opinions of its author, Elliott Gue. The Free Market Speculator is NOT a securities broker/dealer or an investment advisor. You are responsible for your own investment decisions. All information contained in our newsletters and posts should be independently verified with the companies mentioned, and readers should always conduct their own research and due diligence and consider obtaining professional advice before making any investment decision.
Thanks for another very interesting article. I'm no expert on this subject, but it seems to me the process you describe is not stealth easing by the Fed. It's fiscal stimulus by the Treasury, counteracting the Fed's tightening. It's the Treasury that issues the T-bills that are pulling money out of the RRP into the TGA. And, if I'm not mistaken, it's the money spent by the Treasury into the economy that ends up as incressed bank reserves (balancing the banks' increased liabilities in the form of deposits).