

The Bear in Hibernation
The Bear in Hibernation
And the new "V"

The path of least resistance for stocks is higher short-term and it’s time to put the bear back in the cave for hibernation, at least for now.
My view remains the US economy will enter recession this year and equity markets have yet to fully come to grips with the accompanying decline in corporate earnings. Indeed, weak results and/or guidance from the likes of Apple (NSDQ: AAPL), Alphabet (NSDQ: GOOG), Intel (NSDQ: INTC), Amazon.com (NSDQ: AMZN) and Microsoft (NSDQ: MSFT) over the past two weeks would seem to support this view.
As always in markets, there’s no such thing as “good” news and no such thing as “bad” news – it’s how stocks, and the major averages, react to that news that’s important.
What’s most impressive about the action so far this year, is the market’s ability to largely shake off any bad news and rally.
Microsoft dipped 0.6% in the day following its release on January 24th and then proceeded to jump more than 7.4% through Friday’s close.
Intel (NSDQ: INTC) reported its worst quarter in many years, Q4 sales down 28% year-over-year, market share loss, profit margins far below expectations and reduced guidance for the quarters ahead. Even with cost-cutting efforts, INTC is likely to see negative free cash flow for 2 to 3 years; there’s some talk the company’s 4.7% dividend might be at risk.
Even with all that “bad” news, Intel’s shares have rallied, and the stock was trading up just 5 trading days after its earnings release.
As I wrote in last week’s update, bear market rallies often peak at, or slightly above (2% to 3% above), the 200-day moving average. In this case, however, that just hasn’t happened:

Source: Bloomberg
Indeed, the S&P 500 jumped an additional 1.6% over the past week through Friday’s close and is currently more than 4% above the 200-day. The Nasdaq 100, and Nasdaq Composite hit new cycle lows on December 28th, but have now joined the equity party, trading more than 4% above their respective 200-day moving averages despite a bit of selling pressure over the past two days.
Market breadth has continued its recent improvement:

Source: Bloomberg
This chart shows the percentage of NYSE stocks closing above their 200-day moving averages since the beginning of 2021. As you can see, this metric recently surged above 67%, indicating that more than two-thirds of NYSE stocks are trading in uptrends on this basis.
We even had a 90% upside day on NYSE this past week:

Source: Bloomberg
On Tuesday January 31, 2023 90.1% of all volume traded on NYSE was in stocks advancing in price on the session – historically, 90% upside days indicate broad-based demand for stocks.
Typically, during sell-offs you’ll see multiple 90% downside days indicating panic; when followed by one or more 90% upside days, that can signal at least an intermediate-term low in place.
And this signal is particularly powerful when combined with a break higher on the charts – in this case, there was a break above the 200-day moving average coincident with this 90% upside volume surge.
In uptrends, I like to give the benefit of any doubt to the bulls – pullbacks are generally buying opportunities unless there’s overwhelming evidence to the contrary. Similarly, downtrends generally carry on longer, and move further, than the consensus expects, so it’s best to give the benefit of any doubt to the bears and look to sell rallies.
Over the past week, however, there’s been enough of a shift in market behavior to warrant setting the bear case aside for now.
Of course, this change in trend is about more than some colorful squiggly lines on charts.
Shifting Narratives
At its heart, the bullish market narrative making the rounds right now rests on three main pillars:
1. There’s a possibility the US economy could avoid a hard landing (recession) in 2023.
2. Inflation has peaked for the cycle and should continue to recede, allowing the Federal Reserve to pause after 1 or 2 additional hikes, then begin cutting rates to support economic growth by the end of 2023.
3. Last year’s market declines mean stocks have already priced in all the bad news on corporate earnings and economic headwinds, so investors view further dips as an opportunity to buy at attractive prices.
As regular The Free Market Speculator readers know, I have serious doubts about all three of these narratives; the first two are, arguably, mutually exclusive. However, that doesn’t mean these 3 pillars won’t hold sway over markets for weeks as the major indices rally further.
I’ve written extensively about all three in recent issues and I won’t repeat all those arguments here. Instead, let me address each in brief:
The Soft Landing
The market has focused on “hard” economic indicators – including the December employment report released in early January and last Friday’s January Employment Report from BLS – which appear to show still-robust economic growth and strong job creation.
However, it’s important to remember many of these “hard” economic indicators are subject to major subsequent revisions and tend to severely lag changes in economic conditions.
Indeed, the Bureau of Labor Statistics (BLS) employment report released Friday morning included the government’s annual revision to employment data released from December 2021 through November 2022:
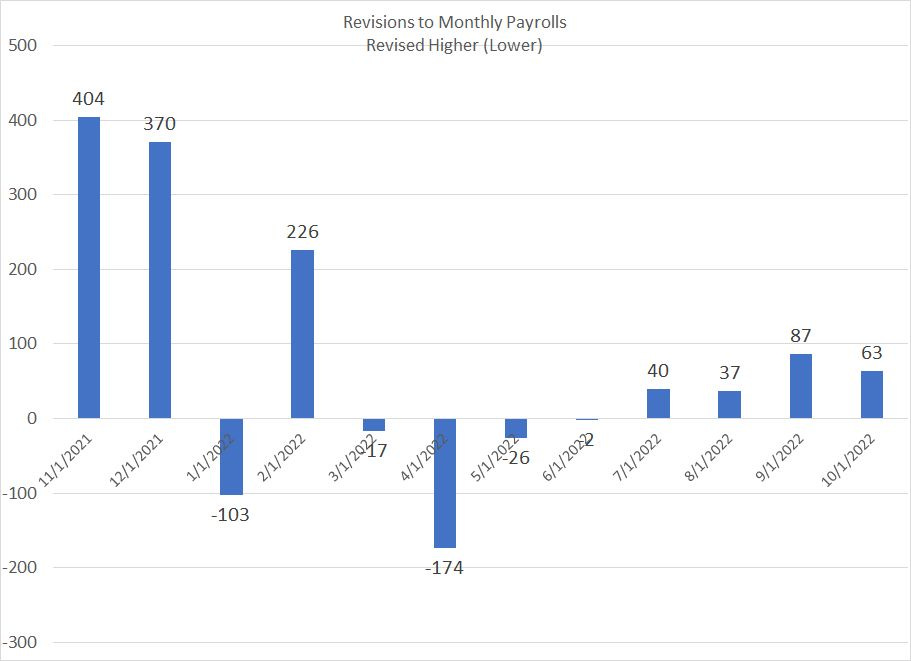
Source: Bloomberg, BLS
As you can see, the government added 774,000 jobs to its initial estimates for jobs created in November and December 2021.
BLS initially estimated the US added 210,000 jobs in November 2021 (this initial estimate was published in early December 2021) and subsequently TRIPLED that to a whopping 614,000 jobs added. The US economy and the jobs market was clearly quite a bit stronger in late 2021-early 2022, just before the Fed started hiking rates, than market participants initially believed.
Given how huge these revisions are, why should we believe the strong December and January payrolls won’t be significantly revised by the time BLS does its final adjustments in a year’s time?
And, if we instead assume these numbers are directionally correct, it seems the plunge in the US unemployment rate to 3.4% in January 2023, the lowest reading since 1969, might put some additional upward pressure on wages. That calls into question the second pillar of the bulls’ argument I noted above (peak inflation/Fed pause/Fed cuts).
However, before I delve into that topic, it’s also worth noting that most of the “soft” economic data – the series that tend to actually lead changes in economic conditions – have been weak of late.
Yes, Friday’s ISM Services release was stronger than forecast, but that’s the exception rather than the rule. Indeed, the ISM Manufacturing report released earlier in the week, which has a longer history and is more sensitive to economic conditions, has now plunged to 47.4, a new cycle low. This is a level we typically only see just ahead of recession.
The Fed Pivot
I must admit, I find the dissection of every word uttered by the Fed and argument over every subtle change in tone at press conferences, an exercise in futility. Quite often, of course, the Fed calls the economy wrong – insistence that inflation was just “transitory” for much of 2021 is just one example of that.
And, if the Fed doesn’t call the economy “wrong,” Wall Street often calls the Fed wrong – market participants who read a “pivot” on rates into the tea leaves of Powell’s press conference last July were quickly crushed when he took a hard hawkish turn at the Jackson Hole conference in late August.
That said, I suppose there was a dovish tilt to last week’s Fed press conference following the central bank’s 25 basis point rate hike.
What really caught my eye was this exchange:
Question from Chris Rugaber, the Associated Press: “Thank you for doing this. As you know financial conditions have loosened since the fall with bond yields falling, which has also brought down mortgage rates, and the stock market posted a solid gain in January. Does that make your job of combating inflation harder? And could you see lifting rates higher than you otherwise would to offset the increase in -- or to offset the easing of financial conditions?”
Response from Jerome Powell: “So, it is important that overall financial conditions continue to reflect the policy restraint that we're putting in place in order to bring inflation down to 2 percent.
And of course, financial conditions have tightened very significantly over the past year. I would say that our focus is not on short-term moves but on sustained changes to broader financial conditions.
And it is our judgment that we're not yet at a sufficiently restrictive policy stance, which is why we say that we expect ongoing hikes will be appropriate. Of course, many things affect financial conditions, not just our policy. And we will take into account overall financial conditions along with many other factors as we set policy.”
Source: Federal Reserve; https://www.federalreserve.gov/mediacenter/files/FOMCpresconf20230201.pdf
My first though on hearing was: What is Powell talking about?
There are many ways to measure financial conditions out there, of course, but most have loosened significantly since last autumn:

Source: Bloomberg
This chart shows the Bloomberg US Financial Conditions Index in blue and the Goldman Sachs version in orange. I reversed the scale of the Bloomberg Index to make the two series comparable – a rising line on this chart indicates tightening financial conditions and vice versa.
As you can see, regardless of which index you care to follow, US financial conditions tightened in the first half of last year as the Fed embarked on an increasingly aggressive tightening campaign and equity markets fell. However, peak tightness (peak hawkishness) ocurred in late September/early-October 2022 and, since that time, financial conditions have gradually eased.
Based on the Bloomberg Index, credit (and equity) markets are more open today than they were in mid-February 2022 before the Federal Reserve began raising rates and quantitative tightening.
And just look at this spread:

Source: Bloomberg
This chart shows the excess yield paid by US corporate borrowers rated “BBB” by S&P compared to the yield on US 10-Year Treasuries – a rising yield suggests private companies are paying more to borrow money and financial conditions are tightening.
Once again, financial conditions on this basis peaked in mid-October when BBB-rated companies paid a 2.25% premium over Treasuries. Since that time, this spread has fallen back to around 1.64%, not far above the long-term average (since January 2018) of about 1.52%.
Bottom line: I suspect the Fed is inclined to hike 25 basis points at its next meeting on March 22nd and an additional 25 basis points on May 3rd. However, following that, it does seem the consensus at the Fed is tipping in favor of a pause to assess the impact of hikes already made.
However, the truth is that regardless of how you care to track this, US financial conditions have been easing for months.
Market expectations the Fed will actually start cutting rates before the end of this year, as inflation gradually glides back to target, represents an Alice in Wonderland level of fantasy.
Perhaps even more important, expectations for a soft landing and Fed pivot are not consistent – if the Fed does pivot, and financial conditions continue to ease, then we’ll likely see some positive inflation surprises by summer that keep pressure on the Fed to hike. And, if the economy is much weaker than data like employment suggest (as I expect) inflation will likely continue to recede and the Fed may start cutting rates, but the landing won’t be “soft.”
The Bad News is in the Price
Finally, there’s the good ‘ole catch-all argument that stocks have already priced in the weakness.
Unfortunately, unless the economy accelerates much faster than expected, stocks are still very expensive. Take Microsoft (NSDQ: MSFT) as an example, trading at almost 28 times earnings estimates for the fiscal year ended June 2023 despite the fact that earnings are expected to shrink in the current fiscal year relative to the year ended June 2022.
Or, how about Apple (NSDQ: AAPL)?
The stock trades at 25.5 times this year’s earnings estimates; in the decade prior to the beginning of 2020, AAPL rarely fetched more than 20 times forward earnings and averaged about 18 times.
Of course, based on longer-term normalized earnings measures that I’ve written about over the past few months, the S&P 500 now trades at a multiple of around 31 times, more expensive than just about any other time in financial history save the late 90’s and 2000.
And that brings me to the real reason I think stocks have been rallying, and could continue to rally a bit more:
The New “V”
As I noted back in early January, the Wall Street consensus heading into this year was V-shaped – a sell-off on growing evidence of an economic downturn in H1 2023, followed by a recovery into year-end.
I generally agreed with that outlook though I’m always uncomfortable when my view lines up so closely with the crowd.
The problem is that most market participants expected the stock market to see a new leg lower in early 2023 and adjusted accordingly. It’s difficult to measure sentiment directly; however, Bank of America’s Global Fund Manager Survey indicated that active fund managers held larger-then-usual cash balances towards the end of 2022.
We also know futures market positioning has been leaning bearish – non-commercial traders and speculators have been holding unusually large net short positions in the S&P 500 and Nasdaq futures.
(Note: Due to a hack of trading systems, the CFTC Commitment of Traders data I use to assess near-term sentiment in the futures market was not released for last week).
There’s also been a “dash for trash” this year.
Some of the biggest gains in 2023 have been in stocks that were most heavily shorted at the end of last year – Carvana (NSDQ: CVNA), likely to go bankrupt this year, has tripled since late December and meme stock Gamestop (NYSE: GME) is up 36.6% since the close on January 5th. Indeed, so far this year a strategy of buying the 20% of US stocks with the highest short interest has returned 16.81%, more than double the S&P 500’s return and comfortably better than the 12.9% return in the Russell 2000.
Investors have clearly been covering their shorts this year likely due to fears of further market upside.
The pain trade has been up to date.
Investors got caught leaning the wrong way at the end of last year and are now living in Fear of Missing Out (FOMO) on additional market upside. It’s all that cash sitting on the sidelines and short-covering fuel that’s likely driving markets higher this year. That’s also behind the sudden embrace of the (internally inconsistent) Soft Landing - Fed pivot - Buy the Dip narrative.
The problem at this juncture is that moves of this nature can carry on a lot longer, and move far further, than most expect.
While stocks have sold off from last week’s highs, there will remain a strong bias in favor of buying the initial dips at least until there’s a real change in the narrative – either clear proof a recession is imminent or an upside surprise on inflation.
Given market reactions to earnings season thus far, I don’t believe downside earnings surprises from the companies that have yet to report will be enough to derail the rally. And, while I suspect fund managers are starting to put their excess cash balances to work, it may well a few more weeks before FOMO and short-covering fuel is fully depleted.
If I had to take a stab at a possible turning points it would be the Fed’s next meeting on March 22nd. Over the month and a half until then, I’ll continue to monitor the weekly data on futures market positioning from CFTC, and the monthly data from the Bank of America Global Fund Manager’s survey, for some clues the market “pros” are no longer underweight stocks and overweight cash.
However, at this time, it looks like we may still get the V-shaped move this year, only inverted – the powerful bear market rally currently underway to start the year, followed by a bull trap and a new leg lower into the second half of the year.
My central case remains that we see a recession starting by the middle of this year and that the S&P 500 ultimately sees a 30%+ “average” bear market decline from all-time highs in early 2022 to the 3,000 to 3,100 range at a minimum.
For now, however, the bear is in hibernation.