

The Case for a Hard Landing

Soft landing is now the consensus on Wall Street with Goldman Sachs the latest bulge bracket bank to lower the probability of recession in the coming year to just 15%.
And, on a superficial basis, the economic data released over the past few months supports that narrative or the mythical unicorn “no landing” scenario where the economy continues to grow at a trend or above-trend pace; yet, inflation magically glides back to target.
A closer look reveals a different picture.
Let’s start with last week’s widely watched Employment Situation Report from the Bureau of Labor Statistics (BLS).
The headline data looks just fine – the US added 187,000 jobs in the month of August 2023, a little higher than the 170,000 Wall Street expected just prior to the release. And private payrolls were up 179,000 compared to the 148,000 expected.
However, while the mainstream media talks up the month-to-month payrolls numbers and loyally reports the precise number of jobs added or lost in a given month, don’t forget that per BLS the 90% confidence interval for the monthly employment report is +/- 130,000 payrolls.
So, when BLS reports the US added +187,000 jobs in August, what the government is really telling you is they’re 90% sure the US added somewhere between 57,000 and 317,000 jobs last month. And I can tell you with something closer to 99% confidence the market reaction to either a +57,000-payroll number last Friday or a +317,000 number would have been different than what has transpired over the past few trading days.
And history suggests there’s a growing probability the actual level of payrolls gains in recent months is closer to the low end of that confidence interval than the top of the range.
Take a look:

Source: Bloomberg, BLS
This chart compares initial estimates of monthly changes in US nonfarm payrolls to the final revision from BLS where negative numbers indicate subsequent downside revisions.
BLS uses a statistical model to estimate US payrolls each month based on surveys of businesses and households. As a rule of thumb, statistical models are useful, but often struggle at major turning points or changes of trend.
As I’ve labeled in the chart above, you can see payrolls numbers released just before and in the first few months of a US economic downturn are often subject to sizable subsequent downside revision. That was true in late 2000 and early 2001 just before the mild US recession that started in March 2001. And it’s even more apparent in the data from 2007-08 around the time the US entered the Great Recession of 2007-09.
You can also see some significant downside revisions in late 2018 and through 2019 (not labeled) though, as you might expect, those revisions were dwarfed by the chaos of economic lockdowns through 2020-21.
What’s interesting is every single payrolls number so far in 2023 has been revised lower in subsequent months except, of course, for the just-released August data, which will see its first revision when September employment data is released early next month.
And some of these revisions are sizable; for example, back on July 7th the government reported the US added 209,000 jobs in the month of June 2023. In the ensuing two months, the government revised away almost half of those payrolls, reducing the estimate to just 105,000 jobs created. That’s below the lowest Wall Street estimate for June jobs creation as of the close on July 6th.
In total, BLS has revised away 355,000 jobs gains it initially reported through the first 7 months of 2023.
Let’s put that in historical perspective:
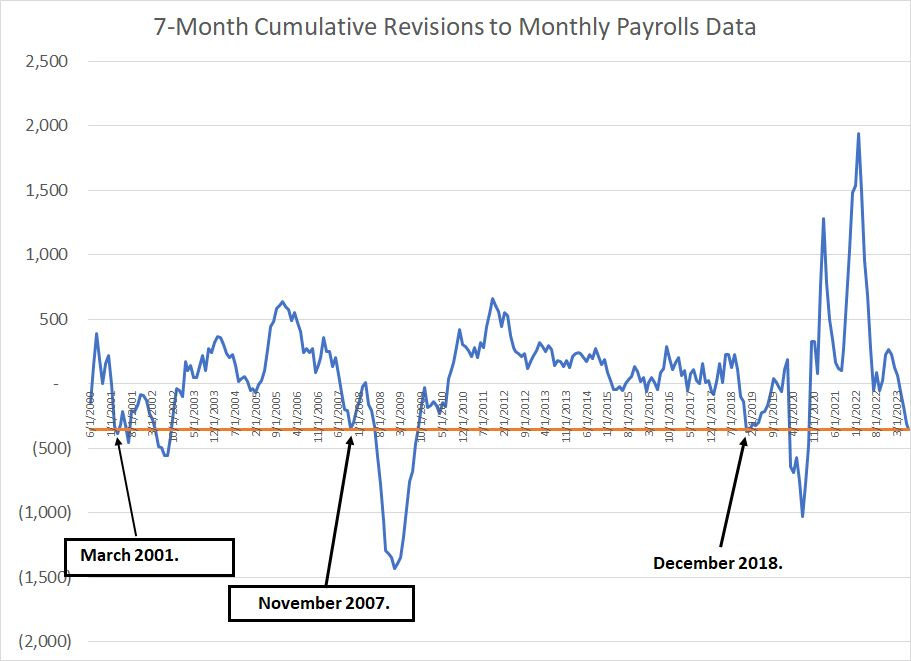
Source: Bloomberg, BLS
This chart shows cumulative US non-farm payrolls on a trailing 7-month time frame since 2000. The horizontal orange line is at -355,000, equivalent to the level of downside revisions we’ve seen over the first 7 months of 2023.
As you can see, BLS downside revisions have only approached the current level on 3 occasions over the past 23 years. The first two examples are early 2001, roughly contemporaneous with the start of recession in March 2001, and November 2007 with the National Bureau of Economic Research (NBER) dating the start of that economic downturn to December 2007, just a month later.
There was no recession in 2018 or 2019 following a similar level of downside payrolls revisions. However, the market declined (just) under 20% on a closing basis in Q4 2018 and the economy weakened enough by the middle of 2019 that the Fed canceled planned rate hikes and cut rates 75 basis points between July and October 2019.
We all know what happened in early 2020 following the COVID outbreak and related lockdowns; it’s quite possible the US economy, already clearly in the latter stages of an expansion, was destined for recession at some point in 2020 with or without COVID.
One more point: BLS revises payrolls numbers in multiple stages each year. First, BLS revises the prior two months’ numbers with each month’s release. Then, in late August, the government does a preliminary benchmark revision covering the first three months of the calendar year. Finally, in early February each year BLS announces a more comprehensive benchmark revision of the prior year’s data.
On August 23, 2023, BLS announced a 306,000 payrolls downsides revision to previously reported payrolls estimates for the first three months of 2023 including a 358,000 in downward revisions for private payrolls partly offset by a 52,000 upward revision to government payrolls.
What’s crucial is that this 306,000 downward revision is not included in the chart or payrolls revisions I posted above, because the government does not adjust monthly data based on its preliminary benchmark revisions. BLS will update the monthly figures as part of its final revisions next February when it releases the January 2024 monthly employment data.
That means it’s quite possible – even likely – the ultimate downside revisions to payrolls data through the first 7 months of this year will be far higher than -355,000 jobs. That’s a level we’ve historically only seen when the economy is close to, or already in, the throes of economic downturn.
And that brings us to this:
Gross Domestic Product and Income
Just last Wednesday, the US Bureau of Economic Analysis (BEA) released its second estimate of Q2 2023 Gross Domestic Product (GDP).
Long story short, the US economy grew at a 2.1% real (inflation-adjusted) annualized pace in Q2. While that’s down from the government’s preliminary estimate released about a month prior of +2.4%, it’s far from a negative number (shrinking economy).
You may have even heard the old rule of thumb that a recession is defined as two consecutive quarters of negative real GDP growth. Since the US economy grew 2% on a similar basis in the first quarter of this year and the Wall Street consensus is for growth of 2% in the current quarter (Q3 2023), a recession might seem a remote possibility.
However, as I’ve explained in past issues, the oft-repeated 2 quarters of negative growth rule isn’t a particularly useful definition of recession. After all, on that basis, the US economy didn’t enter an actual recession until the fourth quarter of 2008, more than a year after the stock market peaked and after the bulk of the 2007-09 bear market declines were already in the rearview mirror.
Indeed, on the same basis, the US never entered recession in the 2000-02 period despite a near 50% decline in the S&P 500 and a spike in unemployment from a low of 3.8% in 2000 to a high of 6.3% in 2003.
Most instead use recession dates defined by the National Bureau of Economic Research’s (NBER) Business Cycle Dating committee. NBER use a much wider range of economic indicators to help define the US business cycle and, while they typically only announce the start of recession long after the fact, their business cycle dates are invaluable for historical study of market cycles.
NBER does use GDP as one of the indicators it follows to date recessions; however, rather than using GDP in isolation, NBER uses an average of GDP and a second measure of the size of the economy known as Gross Domestic Income (GDI).
Theoretically, GDP and GDI should be equivalent because they represent two different ways to measure the same thing, namely the size of the US economy. And, most of the time, the two measures are pretty close; however, that’s not always the case.
Take a look:
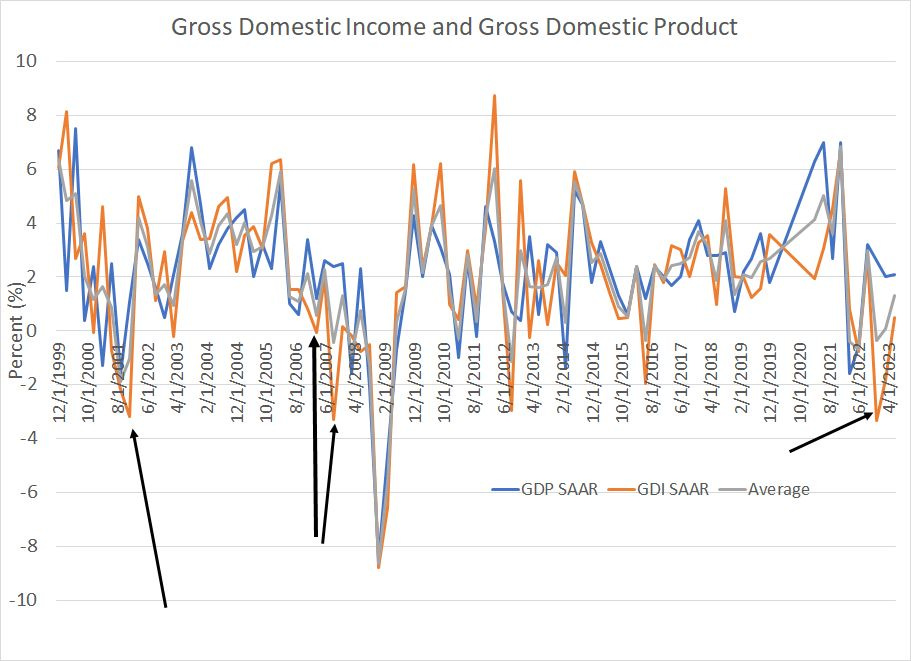
Source: Bloomberg, Bureau of Economic Analysis (BEA)
This chart shows sequential quarterly changes in US real GDP (blue line) and real GDI (orange line) on a seasonally adjusted annualized basis. BEA releases the GDI data as part of its second estimate of quarterly GDP, including the data released last week.
I’ve also included a simple average of the two measures (grey line) which is the metric used by NBER and, therefore, likely something the Federal Reserve also watches closely.
I’ve removed the entire year of 2020 from the chart because wild swings in both measures in that year make the rest of the chart tough to read.
What’s clear is the two measures of the economy are closely correlated; however, since the late 1990’s GDI will often show signs of weakness before GDP. In particular, note the deterioration in GDI back in late 2000-early 2001 and 2006-07, ahead of the recessions in each era.
We’re seeing a similar divergence since late last year. In Q4 2022 GDI was down 3.3% compared to 2.6% growth in real GDP while in Q1 and Q2 2023 GDO was down 1.8% and up just 0.5% respectively.
Let’s look at this data in a second way:
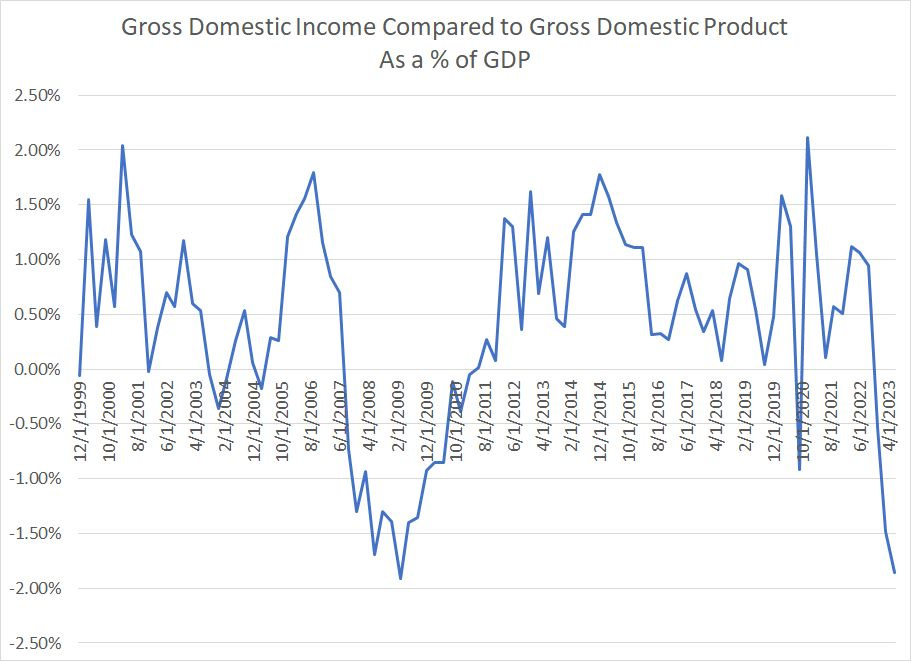
Source: Bloomberg, BEA
This chart shows the difference between the current real level of GDI and GDP as a percentage of GDP. Negative numbers suggest GDI is lower than GDP and vice versa.
What’s interesting is real GDI is normally a bit higher than real GDP over this time period except for a few key periods including 2001, 2007-2010 and 2020. Of course, all these periods roughly coincide with quarters immediately prior to, during or following a US recession.
Right now, GDI is the weakest compared to GDP at any time in the last 23 years except for the height of the 2007-09 Great Recession and credit crisis.
Of course, none of this is conclusive proof the US is poised to enter recession. However, it all points to an economy that’s not as strong as some of the headline numbers would suggest.
Further, this helps explain why you’ll often hear talk of a “soft landing” for the US economy in the run-up to recession, even severe downturns such as 2007-09. The nature of economic data is that it often presents a muddled picture of the health of the economy while lags between monetary, fiscal policy and economic data can be long and of inconsistent duration.
My view remains recession is likely over the next 12 months and, the more Wall Street economists, analysts and investors embrace the soft landing narrative, the greater the ultimate risk to stocks.
It’s equally important to note that even if my view proves correct and we see further evidence of recession in the data in coming months, the stock market won’t necessarily react immediately:

Source: Bloomberg
This simple chart can help put broader market trends into perspective. It’s the closing price of the S&P 500 overlaid with the 100-day and 200-day moving averages for the index.
As rule of thumb, during bull markets and major rallies, the S&P 500 will typically find technical support in (or near) the region bounced by the 100- and 200-day moving averages. The August correction in the S&P 500 measured less than 5% from closing high to closing low and bottomed out above the top of the moving average range just described.
Ultimately, I believe the cycle will out and stocks have significant downside risk, below the autumn 2022 lows. For now, despite mounting risks, the broader market remains in a solid uptrend.
DISCLAIMER: This article is not investment advice and represents the opinions of its author, Elliott Gue. The Free Market Speculator is NOT a securities broker/dealer or an investment advisor. You are responsible for your own investment decisions. All information contained in our newsletters and posts should be independently verified with the companies mentioned, and readers should always conduct their own research and due diligence and consider obtaining professional advice before making any investment decision.