


The Energy Transition Recession
The tragic evisceration of Europe's economy...

One of my favorite annual reports on global energy markets is the Statistical Review of World Energy, typically released around the middle of the year.
For many years it was published by BP (London: BP/; NYSE: BP); the supermajor recently passed the baton to the Energy Institute, a London-based professional membership group for those in the energy industry.
Regardless, the Statistical Review is a veritable treasure trove of data on the global energy business including supply and demand statistics broken out by country and region and dating as far back as 1965.
I’ve been an avid reader of the Review for more than 20 years now, particularly the extensive spreadsheet of data that’s included as part of the report.
Here’s a longer-term trend that caught my eye in this year’s release:
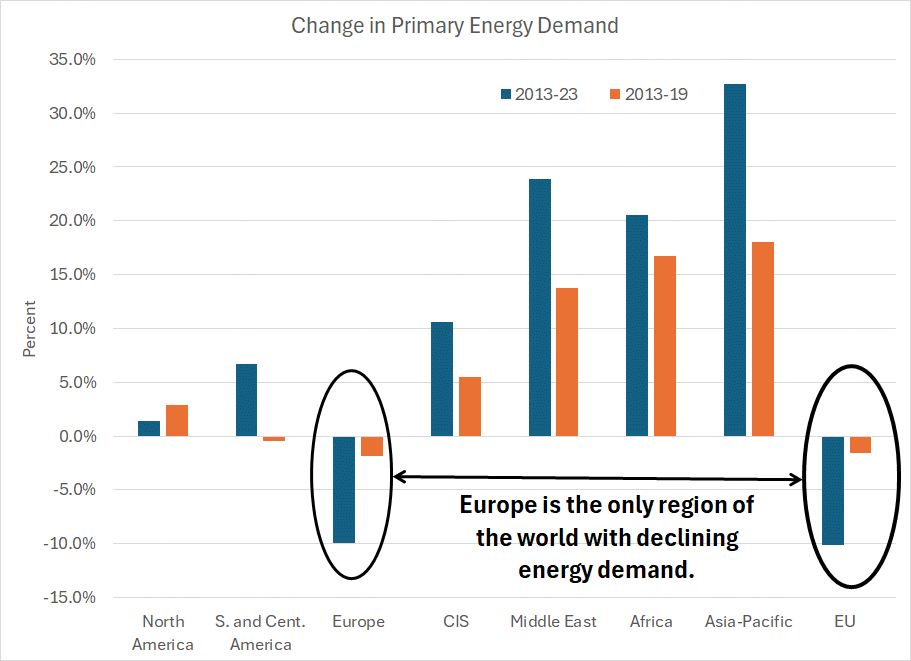
Source: Energy Institute Statistical Review of World Energy, 2024
Primary energy demand is a measure of energy consumption for all purposes whether it’s oil used to fuel an automobile, natural gas used in home heating or as a fuel at a manufacturing facility, or electricity generated at a solar facility.
You’ve probably heard or read statistics about how much electricity a particular country generates from solar, wind or coal. The problem is electricity is only one form of energy – primary energy demand is a more comprehensive measure because it includes energy used in all forms and by all sectors of the economy.
Energy Institute divides the world into seven main regions, all of which are listed on my chart above. Most are self-explanatory; CIS is an acronym that stands for the Commonwealth of Independent States, a group of counties that includes Russia, Kazakhstan and Belarus, among others.
I’ve also included data for the European Union (EU), derived from the same report. Of course, the EU member states are also included in the Europe regional category.
Regardless, what really stands out is that Europe and the EU are the only regions of the world seeing declining primary energy demand.
That’s not a simple consequence of draconian COVID-related lockdowns and travel restrictions imposed across the region in 2020-21, or even the regional energy crisis sparked by Russia’s invasion of Ukraine in 2022.
I’ve expressed the growth in primary energy demand over two distinct time frames. The first shows total primary energy demand growth from 2013 through 2023 and the second shows energy demand growth from 2013-2019, the period immediately before the COVID outbreak and about two full years before the disruption of Russian exports to the EU.
Over the decade ended in 2023, EU energy demand fell about 10%. However, even in the years leading up to COVID, when global energy commodity prices were relatively low, EU demand shrank about 1.6%.
Of course, we’d expect developed countries to show slower growth in energy demand than emerging markets like China or India. The latter two countries accounted for almost 72% of primary energy demand in EI’s Asia Pacific region in 2023; rapid economic growth in these two counties helped power a 32.7% surge in primary energy demand for the region in the 2013-23 period.
However, EI’s North America region is dominated by the US – the world’s largest economy accounted for about 81% of North American energy consumption last year with Canada accounting for 12% and the remaining 7% from Mexico. And US primary energy demand rose about 1.8% over the period from 2013-23 and almost 2.9% from 2013 through 2019.
Europe’s sliding energy demand stands out even among other developed countries. Indeed, if we exclude the EU from the Organization of Economic Cooperation and Development (OECD), a proxy for developed countries, total developed world energy demand rose about 0.8% over the past 10 years.
And that brings us back to a point we’ve made before in Free Market Speculator –energy demand and economic growth are two sides of the same coin.
Consider the case of Germany, the largest economy in the EU. According to the International Energy Agency (IEA), industry accounts for around 25% of total final energy consumption with residential demand at 25.6% and transport at 23.5%. And, of course, Germany has long been known as a world-class manufacturing power:
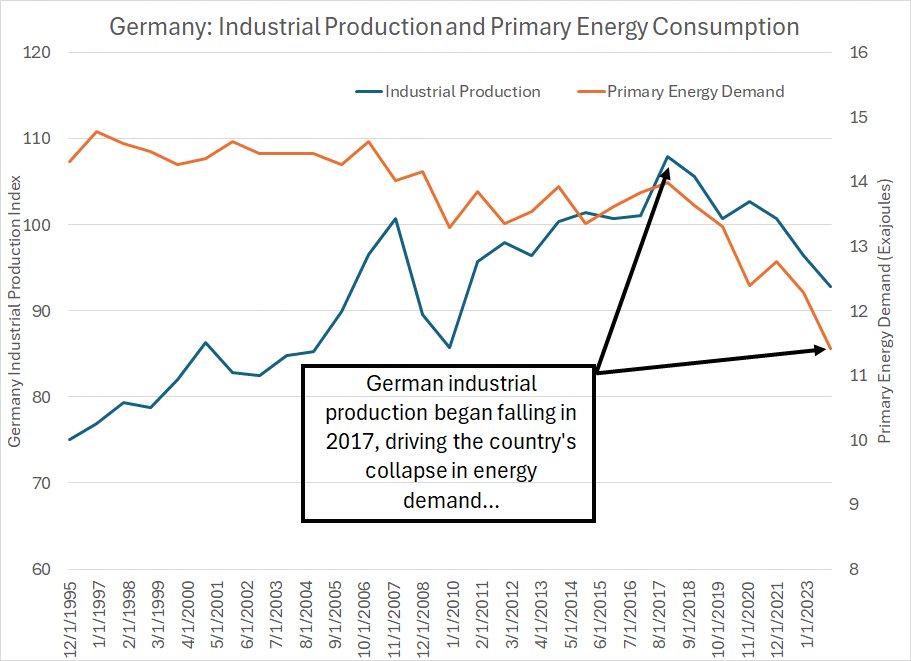
Source: Energy Institute; German Federal Statistical Office and Bloomberg
Industrial production is a measure of the total output of a nation’s industrial sector: Manufacturing, mining and utilities. Given the importance of Germany’s industrial base to the overall economy and employment – about 27% of the total labor force compared to less than 20% in the US – IP is a good proxy for German economic health.
The figures for IP I’ve included in my chart are for December of each year while the annual primary energy demand is derived from the Statistical Review.
German IP remained in a steady uptrend from the mid-1990s though a peak in 2017. Growth over this period was interrupted only twice amid the 2001 and 2007-09 recessions. Those disruptions were temporary with IP resuming the erstwhile primary growth trend as the global economy regained its footing.
There’s been a more sinister shift since 2017 as German IP experienced its worst and most protracted decline in at least 3 decades. As of December 2023, Germany’s IP was back to 2010 levels.
Two points.
First, Germany’s economic and industrial troubles began long before anyone had heard of COVID and long before energy price spikes and natural gas supply disruptions associated with Russia’s invasion of Ukraine in 2022.
Second, falling German and European primary energy demand is a direct consequence of weak economic growth that has little to do with either COVID or the loss of relatively low-cost Russian supply.
We can take this a step further and conclude that access to relatively low and stable energy prices is a key component of any healthy economy:
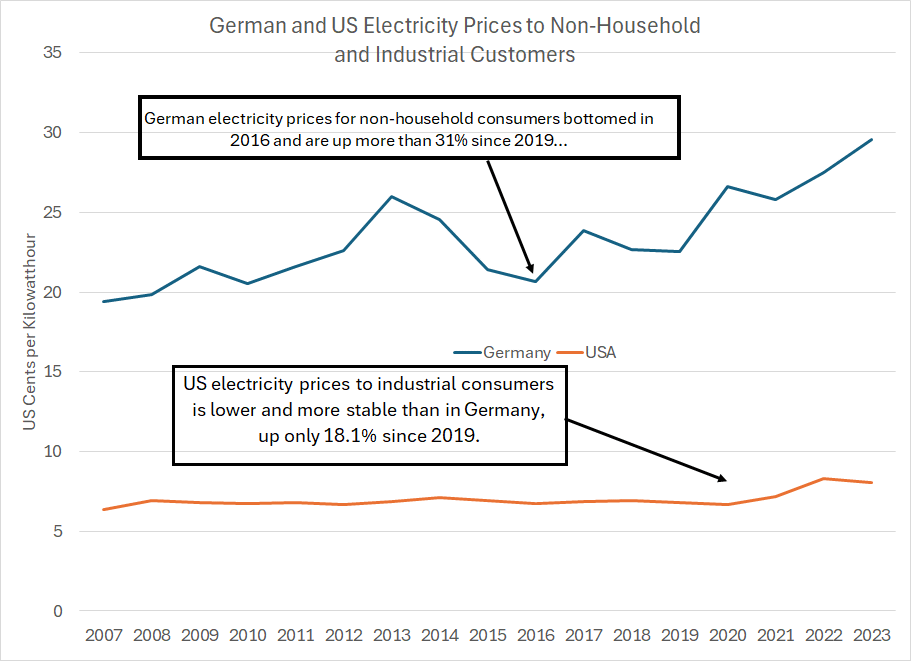
Source: Eurostat, Energy Information Administration
The EU’s Eurostat website offers semiannual statistics on electricity prices in EU countries in euros per kilowatt-hour. The EU also breaks out the data to show prices for households and non-household consumers (such as industrial end-users). The US Energy Information Administration provides more granularity, showing prices in cents per kilowatt-hour on a monthly basis broken down into multiple categories including households, commercial users and industrial customers.
So, to create this chart I’ve calculated annual average electricity prices for German non-household users and US industrial end users since 2007, converting the EU series to the US standard US cents/KWh at the end-of-year dollar-euro exchange rate.
As you can see, US electricity prices have been consistently lower and far more stable than in Germany over this entire period. And while commodity price inflation is a global phenomenon, US electricity prices have risen at a far slower pace since 2019 than in Germany.
Also note that German electricity prices found a cycle low in 2016 and then began to trend higher with the increase accelerating in 2020-21. That corresponds to the onset of weakness in German industrial production and primary energy demand in 2018.
Europe’s Energy Transition
Let’s turn back to the US and German experience in terms of renewable energy technologies:
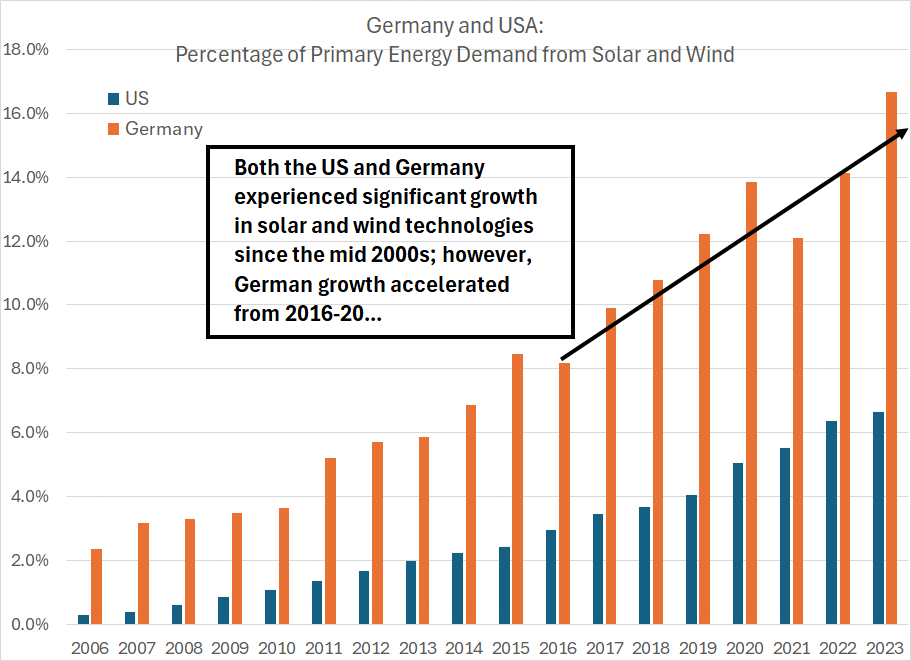
Source: Energy Institute Statistical Review of World Energy 2024
This chart shows the percentage of primary energy demand derived from solar and wind in both the US and Germany over the period from 2006 through 2023.
A few points to cover here.
First, you may have heard or read stories about Germany getting 100% of its power from renewables in a particular day. While strictly true, that’s misleading – as I noted earlier, electricity is only one piece of total energy demand and understates the importance of commodities like oil and natural gas in applications like winter heating, agricultural fertilizer production and manufacturing.
In terms of primary energy demand, the US derived 6.6% of its energy from solar and wind in 2023 and more than 80.5% from oil, natural gas and coal. Germany, in contrast, derived 16.7% of energy from solar and wind and a little over 75.0% from crude oil, natural gas and coal.
Germany is often lauded as a leading adopter of renewables; however, the contrast with the US in terms of fossil fuels’ share of primary energy demand is relatively modest. That’s because the US derives far more energy from hydroelectric than Germany and about 7.8% from nuclear compared to none for Germany. Fossil fuel market share in Germany is only about 5% lower than in the US.
Second, note that in both countries solar and wind have experienced dramatic growth over the 2006-2023 period albeit relative to a low base. US energy production from the two largest renewables has grown from 0.3% in 2006 to 6.6% in 2023 while Germany has seen growth from 2.4% to 16.7% over the same period.
However, what’s interesting is growth in German renewables accelerated from 2016 to 2020, timing that corresponds to the jump in German electricity prices and the deterioration in industrial production trends.
It can be difficult to parse out cause and effect when it comes to trends of this nature. However, two things are clear.
First, percentages are just fractions, therefore, there’s a numerator and denominator.
So, rising renewable share of primary energy consumption can be driven by two basic trends, a rise in renewable generation (a rise in the numerator), or a decline in primary energy consumption (the denominator). Indeed, in most cases it’s likely to be the interaction of both forces.
In both the US and Germany, renewable energy production is growing; however, for the US, so is primary energy demand. A growing primary energy denominator makes it more difficult for renewables to grow as a percentage of total energy demand in the US, while a shrinking denominator has the opposite effect in Germany.
That’s particularly true when you consider that 31.2% of the energy used by German industry in 2020, before the EU energy crisis, came from natural gas. Moreover, around 37% of all German industrial gas demand in 2020 was for energy-intensive chemicals manufacturing industries. So, the decline in Germany’s industrial base since 2017 and the acute decline in energy-intensive industries since 2021 has been a key driver of German “success” with renewables in recent years.
I’d argue there are good and bad reasons for renewables to gain share in the energy mix. A “good” reason would be growth in solar and wind as part of a diversified energy mix needed to meet growing demand.
A “bad” reason is a decline in overall primary energy demand due to a declining industrial base, weak economic growth and recession. In this case, the US is a closer to an example of the former while Germany, and the EU more broadly, are examples of the latter.
Second, it’s tough to argue the very rapid German “transition” in favor of renewables, underwritten by government policies, subsidies and mandates, didn’t at least contribute significantly to the contemporaneous increase in German energy prices. And, of course, as I outlined earlier, rising energy prices tend to have a chilling effect on economic growth, particularly in more energy-intensive sectors of the economy like industry.
As I explained, Germany and the rest of Europe are outliers of the global energy story, showing declining demand while the rest of the world shows growth.
So, let’s look at how the wider world has been meeting growing demand for energy in recent years:

Source: Energy Institute, Statistical Review or World Energy 2024
As we’ve explained in prior issues, the Big 3 fossil fuels – oil, gas and coal – collectively accounted for 81.5% of global primary energy consumption in 2023. Solar and wind chipped in just 2.5% and 3.5% respectively.
However, the chart above is far more specific:
It shows the contribution of various fuels and sources to global primary energy demand growth over the 2018-2023 period alone. I’m showing the statistics for the world as a whole, non-OECD (developing) countries and the world excluding the EU.
There’s no doubt solar and wind have been growing at a rapid pace in recent years. However, the Big 3 fossil fuels still enabled 42.8% of global energy demand growth worldwide, 53.2% excluding the (shrinking) EU market and 65.9% in non-OECD countries.
In other words, fossil fuels’ commanding market share of global energy consumption is partly a consequence of a massive installed base of equipment, built up over many decades, designed to consume the fuels. However, even if we examine only recent trends – changes over the past 5 years – fossil fuels are still a crucial component of the global energy mix.
Indeed, if we exclude the shrinking EU energy market from the world total, fossil fuels account for 53.2% of global energy demand growth in the past 5 years compared to solar at 19.3% and wind at 15.2%.
There are three main implications:
First, recent forecasts from groups like the International Energy Agency (IEA) predicting an outright decline in fossil fuel consumption by the end of this decade are unrealistic. Fossil fuels are the primary means of meeting growing global energy demand, enabling more than half the growth in demand outside the EU.
Worldwide, outside the EU, coal was the single most important source of energy demand growth worldwide from 2018-2023.
Second, there is a real energy transition underway globally in favor of technologies like solar, wind and, perhaps, nuclear in some markets. However, it’s a gradual, evolutionary process rather than a step-change.
The European experience is proof the unspoken reality of a rapid energy transition away from fossil fuels is “de-growth.”
Renewables’ share of primary energy consumption has grown in Europe at the expense of fossil fuels only because overall primary energy demand in large EU economies like Germany has been shrinking due to economic weakness and the ongoing loss of industrial and manufacturing capacity.
In short, you can’t have a healthy, growing economy without oil, natural gas and coal.
Third, the implied de-growth mantra of a rapid energy transition is unsustainable in the longer term because the economic implications are unpopular.
Investors of a certain vintage will recall the phrase coined by political strategist James Carville during the 1992 Presidential election: “It’s the economy, stupid.”
Simply put, incumbent politicians typically get the blame when the economy is weak, inflation is high, or unemployment is rising. That’s just as much the case in Europe as in the US -- in Germany’s June European elections, for example, the Green Party, the architect of the county’s renewables-centric energy policy, watched its support drop from 20.5% 5 years ago to just 12%.
In short, our view has been, and remains, that meeting the world’s growing demand for energy will require an “all of the above” approach – growth in renewables, nuclear and continued, secure, access to the key fossil fuels that comprise more than 80% of current global primary energy supply at a reasonable cost.
Over the long term, the outlook for energy demand is bright, and a wave of investment in new fossil fuel supply will be needed to meet growing demand. That’s a tailwind for energy stocks.
DISCLAIMER: This article is not investment advice and represents the opinions of its author, Elliott Gue. The Free Market Speculator is NOT a securities broker/dealer or an investment advisor. You are responsible for your own investment decisions. All information contained in our newsletters and posts should be independently verified with the companies mentioned, and readers should always conduct their own research and due diligence and consider obtaining professional advice before making any investment decision.