

The Fab 5

The closing high for the S&P 500 so far this year was on February 2nd at just under 4,180.
That’s right, despite a regional banking crisis and associated bailouts, four monthly employment reports, four Consumer Price Index (CPI) inflation releases, two Fed rate hikes and the better part of two earnings seasons for the S&P 500, the S&P 500 is down 1.33% since its February 2nd close or down about 0.86% if we include dividends paid.
However, the performance of markets since that time has not been even:

Source: Bloomberg
This chart shows the cumulative total return for select indices, stocks and ETFs since February 2nd, a little over three months ago.
You can see the blue line for the S&P 500 showing the Index down under 1% on a total return basis, a classic trading range. Meanwhile, the equal-weight version of the S&P 500 is down more than 8.2% from its close on February 2nd and the Russell 2000 is down a whopping 12.6% over the past three months alone.
Further, the Russell 2000 index of small caps is down year-to-date and within 1% of a key support level at about 1,720, which the index has tested on 3 occasions since late December 2022. If the index were to fall just 5% from here, it would break below last year’s cycle lows at around 1,650, down more than a third from its late 2021 peak.
Interestingly, the ARK Innovation ETF (NSDQ: ARKK), a sort of super-growth index proxy, has also been a notable laggard since the February market peak, falling almost 14.2% in total from its close in early February.
On the flip side of the equation, the Nasdaq 100 is up 4.3% powered by index heavyweights Microsoft (NSDQ: MSFT) and Apple (NSDQ: AAPL) up 16.6% and 14.7% respectively.
My point is that even as the broader market indices – the S&P 500 and Nasdaq 100 – remain near their year-to-date highs, most stocks have fallen over the past 3 months and many have experienced significant declines. Indeed, 56% of stocks in the S&P 500 are down more than 5% since the close on February 2nd while 39% are down more than 10% and more than 26% are down 15%+.
On the flip side of the equation, less than 19% of stocks in the S&P 500 are up more than 5% and only 29 stocks in the index are up more than 15%.
All gains in the broader market since early February are the result of rallies in just 5 stocks: Apple (NSDQ: AAPL), Microsoft (NSDQ: MSFT), Nvidia (NSDQ: NVDA), Alphabet (NSDQ: GOOGL) and Meta (NSDQ: META). This Fab 5 has a combined weight of 21.5% in the S&P 500 and a whopping 43.8% of the Nasdaq 100.
There are 2 obvious implications in my view.
First, if you’re an active investor or an active fund manager that’s seeking to outperform the S&P 500 then you’ve underperformed this year if you’re not significantly overweight these 5 large-cap technology and growth stocks.
It’s that simple and nothing else matters – US equity market performance this year hinges on just 5 (very) expensive stocks:
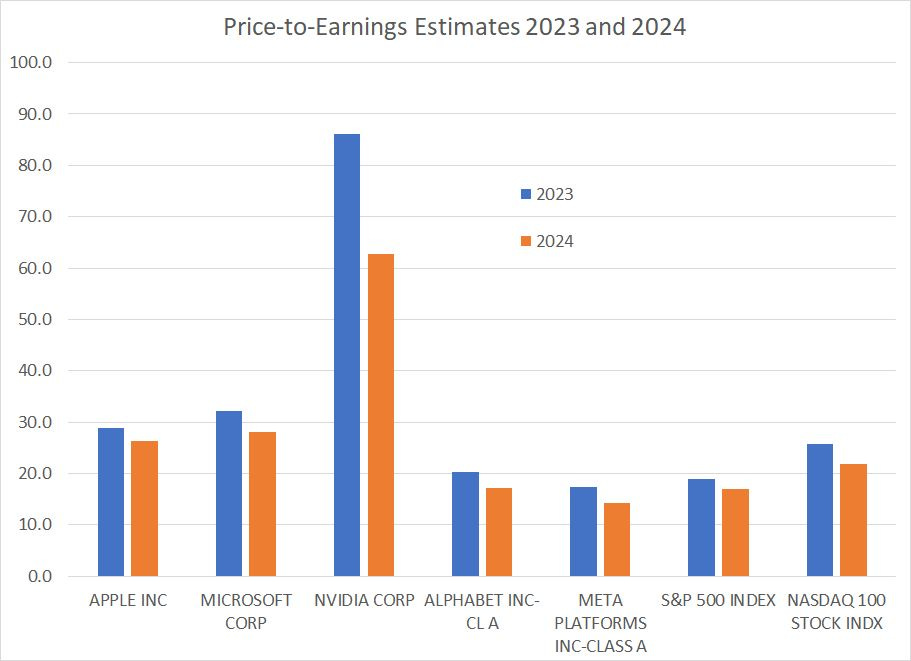
Source: Bloomberg
Of the Fab 5 market leaders only Meta trades at a valuation significantly below that of the S&P 500 based on 2023 and 2024 earnings estimates.
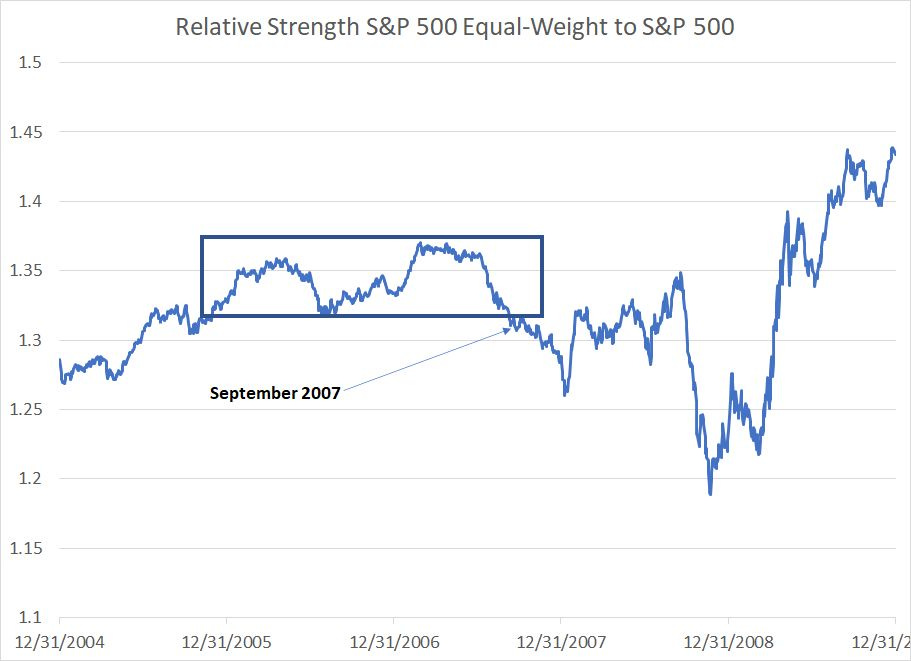
The second implication is that rallies powered by an ever-shrinking group of large-cap stocks are historically prone to failure. Look at this ratio:
Source: Bloomberg
This chart shows the ratio of the S&P 500 Equal Weight Index to the S&P 500 – when this line is rising, it suggests the Equal Weight Index is outperforming the classic market cap weighted version of the S&P 500. The opposite is true when the line is falling, signifying the largest components in the index are driving performance.
As you can see, in the cycle depicted in my chart, this simple ratio broke down in late September 2007 even as the broader market was trading near all-time highs. That’s because the 11.3% rally in the S&P 500 from mid-August 2007 to the ultimate bull market peak on October 9, 2007 was driven by an ever-shrinking group of large cap stocks. This ratio signaled that while the broader indices looked “OK,” there was significant weakness just below the surface.
Just days after this ratio broke down the market peaked, and by early 2008 the vicious 2007-09 bear market was well underway.
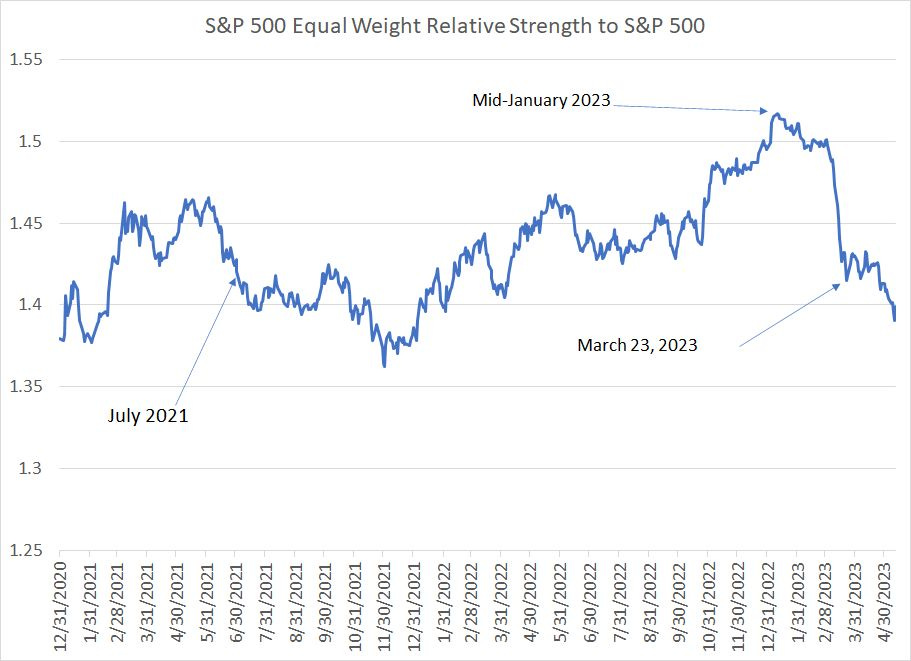
And check out the peak of the bull market in 2021-22:
Source: Bloomberg
A quick glance at this chart shows that this simple ratio broke down in the summer of 2021; the Nasdaq peaked about 4 months later in November 2021 and the S&P 500 less than 2 months after that in January 2022.
In 2023 the ratio peaked in January and broke down to the lowest levels in about a year by late March 2023.
Once again, this ratio is warning us that while the S&P 500 is down less than 1% from its February peak and the Nasdaq is up since that time, there’s a great deal of damage just under the placid surface of the major indices.
Jobless Claims Warning of Recession
Evidence the US will enter recession over the next quarter continues to mount:
Source: Bloomberg
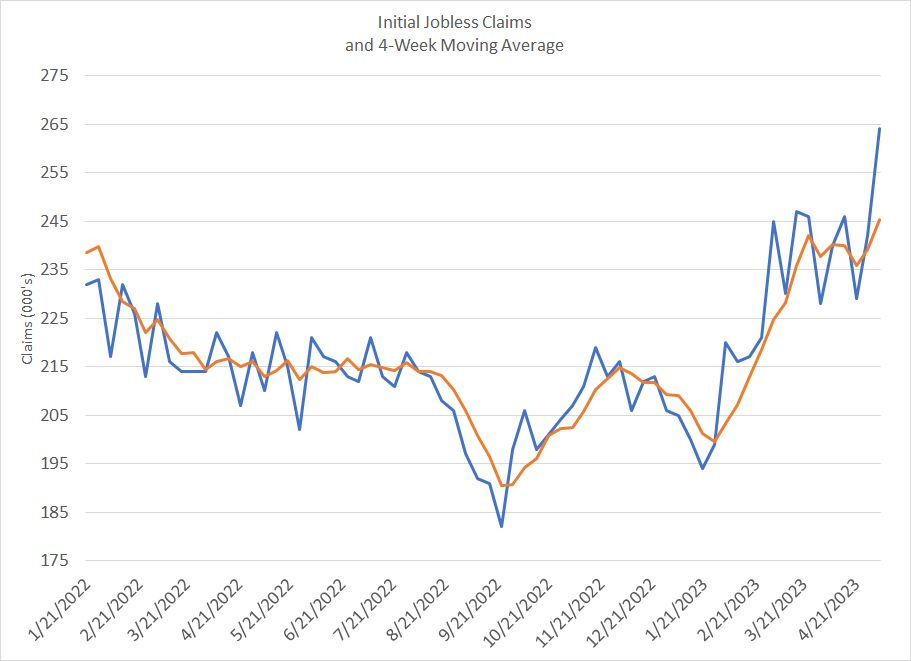
This chart shows weekly initial jobless claims – Americans filing for first-time unemployment benefits – since January 2022, a little over a year ago. I’ve also overlaid the 4-week simple moving average of claims to help illustrate the trend beyond week-to-week volatility.
As you can see, claims have broken sharply higher to 264,000 and the four-week moving average is now at the highest level so far in the current cycle.
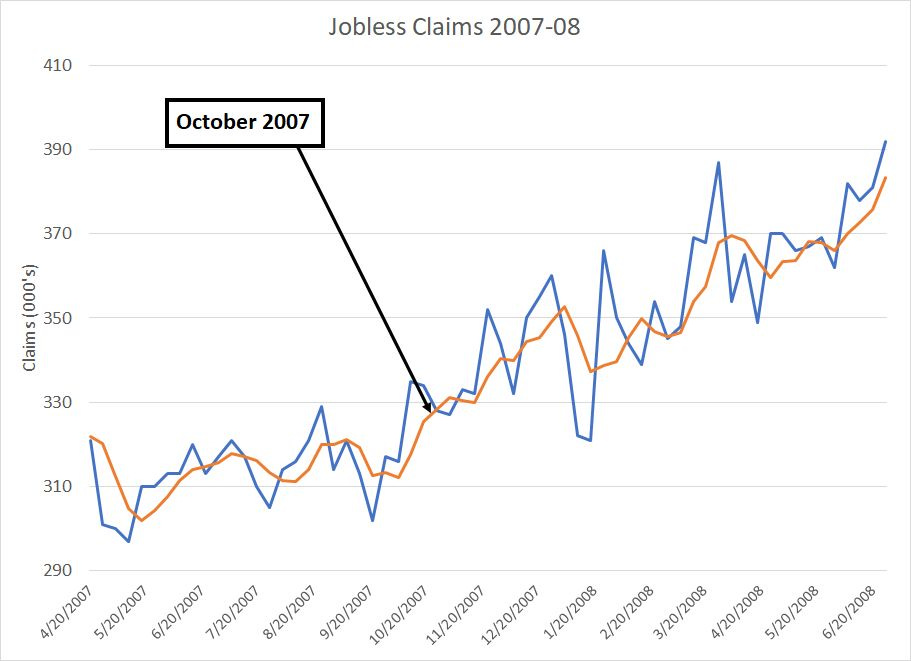
In the 2007-09 cycle, jobless claims began to break higher in October 2007, around the time of the market peak and about two months ahead of the official start of recession in December the same year:
Source: Bloomberg
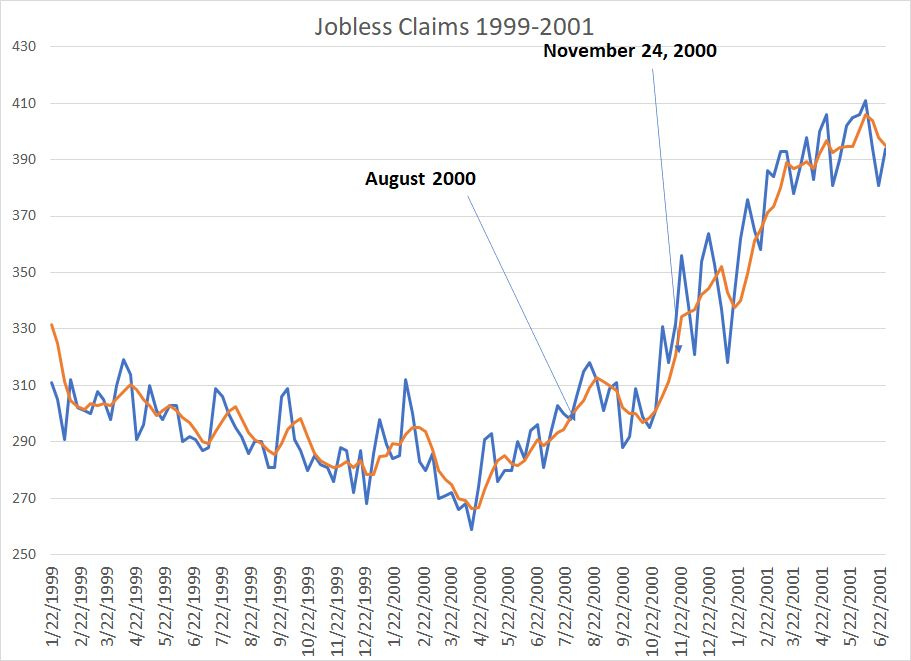
And here’s the same chart showing the jobless claims spike in the summer of 2000, about 5 months before the start of the March-November 2001 recession and around 2 months before the 2000-02 bear market took a turn for the worse:
Source: Bloomberg
Equity markets have been frustrating this year for all but the most ardent bulls buying the Nasdaq 100 ETF (NSDQ: QQQ). However, a narrow market rally powered by stocks trading at close to 30 times forward earnings estimates with the US economy on the cusp of economic contraction just isn’t the recipe for sustainable market upside or a fresh bull market in equities.
Moreover, placid trading in equities and talk of a soft landing isn’t consistent with the message in fixed income:
Source: Bloomberg
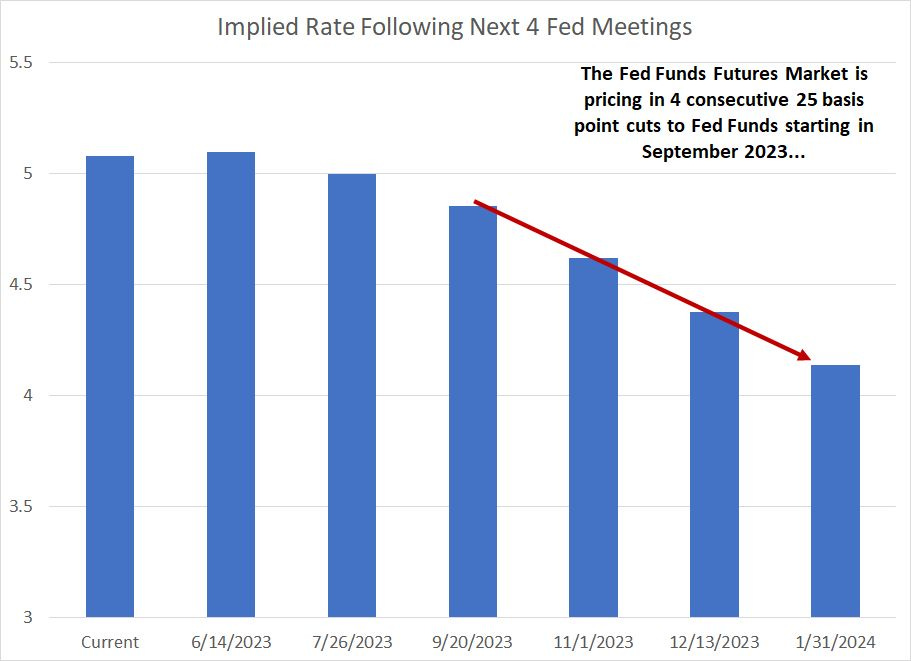
The Fed currently targets a Fed Funds rate of 5% to 5.25% and the effective rate today is just below the midpoint of that range at about 5.08%.
As of Friday’s close the Fed Funds futures are pricing in just 13% probability the Fed hikes once more at its meeting on June 14th; a roughly 87% probability the Fed will pause on rate hikes.
However, markets are only looking for a short pause; current market pricing shows 86% probability the Fed cuts at its September 20th meeting, and high probability that the Fed then cuts 25 basis points at each consecutive meeting from September 20, 2023 through January 31, 2024. That’s a full 100 basis points (1%) of cuts to an implied rate around 4.15% by the end of January next year.
Historically, this is a very dangerous moment to be buying stocks, especially the recent mega-cap market leaders.
If the US enters recession by Q3 of 2023 as I suspect, and data like initial claims suggests, it’s possible Fed Funds futures pricing could prove correct or even conservative. It’s not unusual for the Fed to start cutting rates around the time the US enters recession or just ahead of recession.
However, as I illustrated earlier on in this update, thin market rallies just ahead of an economic downturn are prone to dramatic failures as we saw in 2000 and 2007. In this case, where a deepening recession prompts the Fed to start slashing rates, it’s unlikely Microsoft and Apple earnings would be immune to weakening economic trends. In such an environment it’s also unlikely these “Fab 5” stocks would continue to fetch 30 times forward earnings estimates.
There’s a second possibility which is that the recession is delayed again and the economic data firms this summer. In that case, the Fed Fund futures market is likely wrong – the Fed isn’t going to cut 4 times by next January if the economy remains robust as the central bank continues to warn regarding risks of easing too early before the inflation problem is solved.
Indeed, a reacceleration of economic growth might prompt the Fed to hike again later this year or in early 2024, especially if US inflation remains stubbornly elevated.
In this scenario, with rates elevated then I suspect small and more economically cyclical stocks that have lagged over the past 3 months would rally while big tech could actually get hit by concerns over rising rates. Consequently, ratios like the S&P 500 Equal Weight to the S&P 500 or the Russell 2000 to the S&P 500 would improve and I suspect you’d also see a major rally in commodities like oil.
My view remains that recession is the more likely outcome, accompanied by a new leg lower in the bear market that started in early 2022 as relative strength in the Fab 5 (finally) cracks.
However, bond and equity markets can’t both be right about conditions right now – either the outlook for rate cuts is wrong or the absolute shellacking of small and cyclical stocks is overdone.
DISCLAIMER: This article is not investment advice and represents the opinions of its author, Elliott Gue. The Free Market Speculator is NOT a securities broker/dealer or an investment advisor. You are responsible for your own investment decisions. All information contained in our newsletters and posts should be independently verified with the companies mentioned, and readers should always conduct their own research and due diligence and consider obtaining professional advice before making any investment decision.