

The Great Rotation
The Great Rotation
Changes and a new addition to the FMS Model Portfolio

Last summer, equity markets rallied on expectations the Fed would be ready to “pivot” away from a hiking bias before the end of 2022.
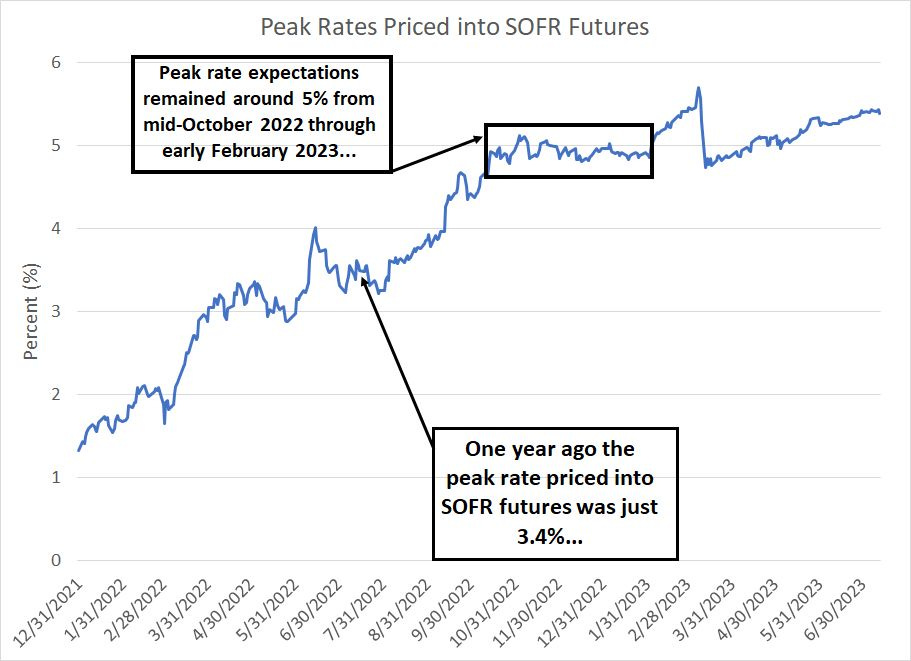
Well, that didn’t quite work out according to plan for the bulls. It seems almost quaint to imagine that one year ago today, futures market participants expected a peak rate of just 3.4% compared to a Fed Funds rate target of 1.75% at that time:
Source: Bloomberg
To create this chart, I examined quarterly Secured Overnight Financing Rate (SOFR) futures, a market that replaced Eurodollar futures in mid-April this year.
These are quarterly futures that track short-term lending rates collateralized by Treasury securities. This chart shows the peak rate priced into the next 2 years’ worth of SOFR futures contracts, a proxy for the maximum rate the market expects in the current hiking cycle.
As you can see, market expectations for peak rates ramped from the beginning of 2022 through to roughly mid-June of last year only to take a breather through the end of August. It was this temporary pause in expectations for hikes that facilitated the bear market rally in stocks through the summer of 2022.
Jerome Powell then threw cold water on the “pivot trade” by giving a hawkish speech at the Jackson Hole Conference on August 26, 2022, kicking off a second round of rising rate expectations and associated stock market weakness.
This year has been a bit of a rollercoaster. As you can see, expectations for peak rates hit 5% in mid-October last year and remained roughly constant through early February 2023.
Then, the real volatility started. First a ramp in Fed hike expectations into early March, encouraged by stronger-than-expected economic data and a slew of hawkish rhetoric out of FOMC members, including Jerome Powell. Immediately thereafter, the regional banking crisis prompted a plunge in peak rate expectations into mid-March followed by a steady trend higher thereafter.
In the last few weeks, we’ve once again approached the early March highs for peak rates; Wednesday’s cooler-than-expected inflation report did little to change the picture with at least one additional 25 basis point hike priced into futures this year.
The Ever-Present Pivot
However, through all this and even when market participants were at their most hawkish there’s always been hope for a massive Fed pivot ahead:

Source: Bloomberg
To create this chart, I once again examined SOFR futures. First, I looked at market expectations for peak rates in 2023 and then I subtracted the rate priced into SOFR futures for December 2024.
Thus, a positive number on my chart indicates the total of expected rate cuts from the peak this year through the end of next year.
What’s interesting is to consider this chart in the context of my chart of peak rates above. For example, back on March 6th, SOFR futures priced a peak rate of just under 5.5%, just a few basis points away from levels we’ve seen this week.
However, on the same date, SOFR futures were pricing in more than 150 basis points (1.5%) in Fed rate cuts from those peak levels through the end of 2024. In other words, the market was looking for the Fed to hike a few more times before beginning a major easing campaign presumably driven by a significant weakening in the economy and the associated easing of inflationary pressures.
As recently as early May of this year SOFR futures were pricing in a whopping 2.3 percent in interest rate cuts from the expected peak level through the end of 2024. That’s almost 10 quarter-point moves over a period of about 18 months.
This week, we hit almost the same level for peak rate expectations as early March – around 5.4% -- however, the market isn’t entirely convinced the Fed will be able to execute the massive about-face pivot that’s been baked into market expectations for much of the past year. At the recent lows, in fact, SOFR futures were pricing in just 120 basis points in cuts through the end of 2024, leaving interest rates above 4% through the entirety of next year.
Granted, the soft inflation print this week caused a bump higher in expectations for the scale of a Fed pivot into 2024; however, we’re still not far off mid-March 2023 levels despite the fact the market sees a higher terminal rate today (about 5.4%) compared to mid-March (4.75%).
There are a few implications in my view.
First, the mainstream financial media focuses laser-like on market expectations for the upcoming July 26th FOMC meeting and the question of whether the Fed might end up hiking one or two more times this year. In other words, the focus appears to be mainly on that peak rate for the current cycle.
However, for 9 months now, market expectations for the peak rate have been rangebound around roughly 5% to 5.50%. There’s just not been much change in peak rate expectations, especially if you compare the past 9 months to the prior period from January through October 2022 when market pricing for Fed tightening ramped aggressively.
The peak rate of the cycle isn’t the only valid way to gauge the stance of Fed policy.
Just as important: Market expectations for how long the Fed is willing to keep policy tight and how aggressive the ultimate pivot and easing cycle might be. And while the market remains convinced the Fed is perhaps a hike or two away from peak rates, the shift is that there’s somewhat less confidence the central bank will be in a position to aggressively ease policy straight through 2024.
This is something to watch as we move through the second half. Even if the market is correct and the Fed hikes 25 basis points later this month and then pauses (again), what’s important is how long the Fed maintains rates at that level.
With core inflation still well above target, is the Fed really going to want to start cutting rates aggressively in 2024 unless the economy shows more persistent signs of weakness?
In my view the answer is no, especially since there remains risk of a dramatic second wave of inflation such as we saw in the 1970s should the Fed declare victory and cut prematurely.
Another interesting, related development is this:
Equities, Rates and the Nasdaq
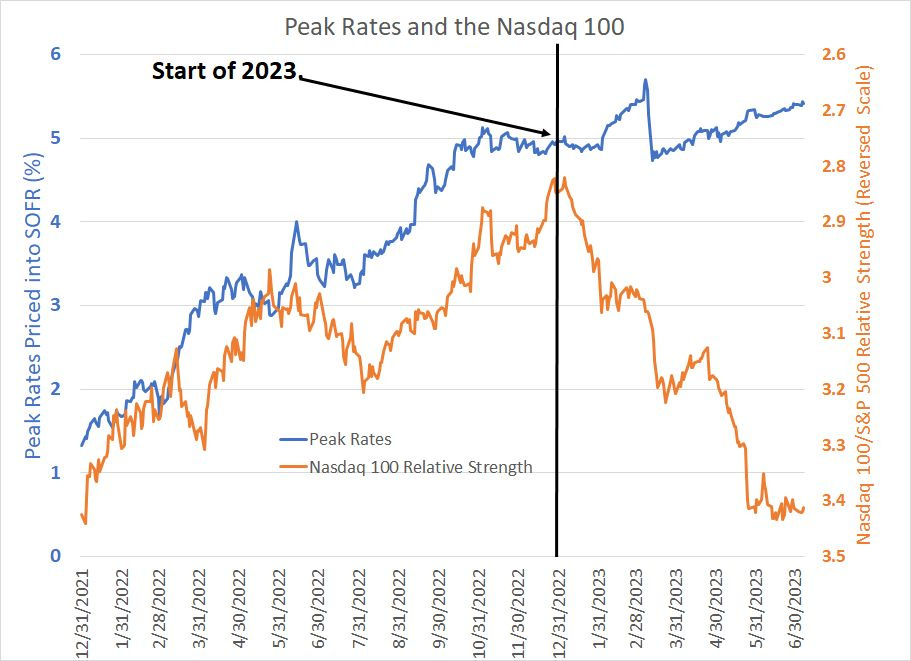
For much of last year, stocks, particularly the Nasdaq, retained a strong negative correlation to expectations for Fed rate hikes:
Source: Bloomberg
I’ve plotted two lines on this chart.
The first is the peak interest rate priced into SOFR futures as I outlined a little earlier on in this issue. It’s a blue line which corresponds to the left-hand scale on my chart.
The second line is a relative strength ratio that compares the Nasdaq 100 index to the S&P 500. This line is pictured in orange, the scale is the right-hand axis and I’ve inverted the scale here such that a rising orange line indicates Nasdaq 100 underperformance.
The relationship here is fascinating.
Last year, the Nasdaq was all about the Fed – when peak rates for the current hiking cycle were rising, the Nasdaq 100 significantly underperformed the S&P 500. And on those fleeting occasions where expectations for peak cycle rates declined, or marched in place, the Nasdaq 100 managed to outperform the S&P 500 for at least a short period.
The flip of the calendar from 2022 to 2023 was like a light switch for this trend – I’ve indicated this shift with a vertical black line on the chart. Starting in January, the Nasdaq has handily outperformed the S&P 500 despite steady-to-higher expectations for peak cycle rates.
Indeed, even during the month of February, and the period from mid-March through early July, when peak rate expectations rose steadily, the Nasdaq managed to sustain its relative strength.
Further, since the end of 2021 the S&P 500 and Nasdaq 100 are both down by a similar magnitude of around 6.2% excluding dividends. That’s despite the fact expectations for the peak of the rate hike cycle have risen dramatically from 1.3% to 5.4% over a similar period.
So much for the interest rate sensitivity of the Nasdaq.
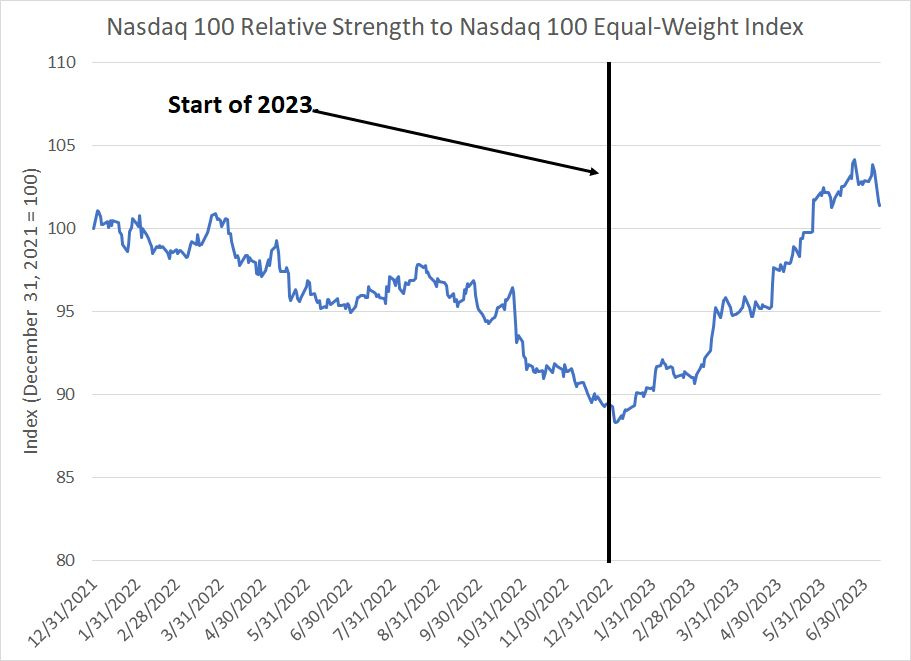
Here’s the likely driver of this change:
Source: Bloomberg
This chart shows the relative strength of the Nasdaq 100 to the Nasdaq 100 Equal-Weight Index; both indices hold the same stocks, but holdings are weighted equally in the latter index rather than by market capitalization (company size).
Simply put, when this line is rising, the traditional cap-weighted version of Nasdaq 100 is outperforming. Put in a different way, this means the largest stocks in the index – names like Apple, Microsoft and Alphabet – are outperforming the average stock in the Nasdaq 100.
Once again, I’ve also marked the start of 2023 with a thick vertical black line – just as in my prior chart, there’s a dramatic change of trend starting with the flip of the calendar to the new year. Specifically, the Nasdaq 100 outperformed its Equal-Weight counterpart by more than 18 percentage points through the first half of 2023 alone.
In short, equities lost their inverse correlation to expected peak interest rates at the same time the very largest stocks in the Nasdaq 100 began to dramatically outperform.
The situation has become so bizarre the Nasdaq has decided to act, announcing a first-ever “special rebalance” of the Nasdaq 100 index.
In a press release issued on July 7th, Nasdaq indicated they’re planning to redistribute the weights of stocks in the Nasdaq 100 to address “overconcentration in the index.” While such a move will not involve removing any specific stocks from the index, it will reduce the weight of some of the largest stocks, including the names that have driven outperformance year to date.
The specifics of the rebalance will be released on Friday July 14th and the rebalancing will take place before the market opens on Monday July 24th.
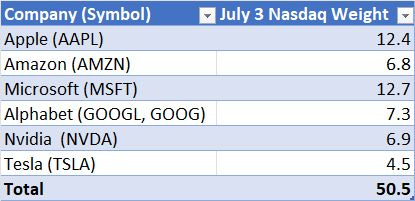
According to the Nasdaq 100 index methodology, constituents are weighted by market capitalization subject to two additional quarterly constraints:
No single issuer can account for more than 20% of the index.
The aggregate weight of all individual Nasdaq 100 constituents with an individual weight of greater than 4.5% may not exceed 48% of the index.
The second constraint here is what’s triggered:
Source: Bloomberg
Nasdaq indicated their decision to rebalance was based on index weights as of July 3rd, 2023, the first trading day of Q3 2023. So, in the table above I’ve listed the six stocks in the Nasdaq 100 with individual weights above 4.5% as of that date and you can see their combined weight is about 50.5%, above the 48% maximum set forth in the Nasdaq 100 Index methodology.
So, at this point, the index methodology calls for setting the aggregate weight of all stocks with market weights over 4.5% to 40% of the index weight. That’s NOT a typo – the Nasdaq methodology paper specifies 48% as a trigger for action and then calls for reducing the combined weight to 40%. Simply put, that means the weight of the six stocks in my table will be reduced by around 10.5 percentage points with the remaining roughly 94 stocks seeing a combined increase in market weights of a similar magnitude.
Granted, the Nasdaq 100 isn’t as important as the S&P 500 because far more funds and managed equity portfolios benchmark against the latter. However, the fact Nasdaq is undertaking a special rebalancing of the index for the first time in its history should illustrate the unprecedented concentration and lopsided performance we’ve seen in markets so far this year.
Just consider, year-to-date the S&P 500 is up about 17.5%, which consists of a 16.5% return from capital gains with dividends chipping in an additional 1%. Since the end of 2022, the blended forward 12-month earnings estimate for the S&P 500 is actually down slightly (about 0.3%), so all index gains year-to-date are the direct result of an expansion in earnings multiples (P/E ratios) investors are willing to pay.
On this basis, the S&P 500 traded at about 17.6 times forward earnings at the end of 2022 compared to 20.4 times today. And the vast majority of the increase in multiples is down to the largest components in the index:

Source: Bloomberg
This chart shows the forward earnings multiple for the S&P 500 in blue and the S&P 500 Equal Weight Index in orange since December 27, 2022.
The S&P 500 Equal Weight Index trades at 16.9 times forward earnings estimates compared to 20.4 times for the market cap weighted version. In addition, as you can see, valuations for the equal weight version of the index have barely budged in 2023, while the market cap weighted version is close to 3 full turns higher than it was in late December.
“Bubble” is one of the most overused, and ill-defined terms in financial markets.
However, here’s the gist: A bubble is when the value of an asset detaches from underlying fundamentals. That describes the current situation with the six or seven largest stocks in the Nasdaq 100 and S&P 500 right now.
Historically, rising real interest rates – nominal rates adjusted for inflation – are bad news for growth stocks as price-to-earnings ratios tend to deflate in such environments. That worked last year; however, in 2023, despite rising expectations for the peak Fed funds rate and the prospect of a less dramatic pivot in 2024, these stocks have experienced a sizable jump in valuations to elevated levels in absolute terms.
The situation has become so extreme Nasdaq – a company almost synonymous with growth and technology stocks – is taking the unprecedented step of reducing concentration in the Nasdaq 100 index.
To top it all off, expectations and valuations for high-profile growth names like Microsoft (NSDQ: MSFT), Apple (NSDQ: AAPL) and Nvidia (NSDQ: NVDA) are spiking just ahead of quarterly earnings season. That’s a dangerous set-up indeed – even if these companies manage to beat elevated expectations or talk up their growth prospects for the quarters ahead, that good news may already be baked into current valuations.
Simply put, I’m looking for a significant shift in market leadership, a shift that may already be underway this month with the S&P 500 Equal-Weight Index outperforming its cap-weighted counterpart by almost 1.5% so far in July alone.
History supports such a shift following the lop-sided, top-heavy market rally through the first half of this year. In the July 4th, 2023 issue of The Free Market Speculator, “A Second Half Change In Leadership,” I took a look at prior first half rallies in the S&P driven by only as handful of sectors.
My conclusion: thin market rallies usually broaden out to include more sectors in the second half of the year. Even more important, the leaders of the advance often change with erstwhile laggards playing catch up.
With these points in mind, I’m recommending a series of changes to the model portfolio this week:
Keep reading with a 7-day free trial
Subscribe to The Free Market Speculator to keep reading this post and get 7 days of free access to the full post archives.