

The Long and Short of Gold
The Long and Short of Gold
Why Gold is a Buy Despite Rising Interest Rates and a Strong Dollar

In one of my premium services, I recommend owning gold in the model portfolio using an ETF called the SPDR Gold ETF (NYSE: GLD)
I’ve received this question a lot recently:
Why own gold?
Two reasons.
First, as I’ve outlined before in the Free Market Speculator, the current economic and market environment resembles that of the 1970s.
Simply put, US fiscal expansion (government spending) and easy monetary policy in the late 1960s and early 1970s brought an end to a prolonged period of benign inflation that had prevailed since the early 1950s.
From roughly 1968 to 1982, the US experienced what’s popularly known as stagflation. The term “stagflation” is, however, somewhat of a misnomer because the economy wasn’t stagnant over this period – real (inflation-adjusted) average annual economic growth was higher in the 1970s than the 80s and only just less than the 1990s.
However, the 1968 to 1972 period was a time of high average inflation rates and what can be best described as a “stop-go” economy – short cycles of rapid growth followed by recession. Indeed, from 1968 to 1982, a period of about 14 years, the US experienced 4 recessions compared to just 1 over the 18-year period from 1982 to 2000.
An environment of high inflation and volatile economic growth makes it tough for businesses to plan and strategize. One manifestation of this is a structural rise in unemployment – the US unemployment rate hovered below 4% from 1966 – 1969 but averaged about 6.8% between the beginning of 1970 and the end of 1982. From mid-1970 through the end of 1999, the unemployment rate NEVER dropped below 4% again.
And that brings me to the current situation.
The US, alongside most developed countries around the world, pioneered the use of alternative monetary tools like quantitative easing following the Great Recession and Financial crisis of 2007-09. In fact, the Fed arguably became addicted to these tools, deploying aggressive and anticipatory monetary easing at the first signs of market turmoil, such as in late 2018.
Then, in 2020-2021 the easy money boom reached a crescendo as the US, again alongside most developed countries, used coordinated fiscal and monetary expansion in an attempt to offset the economically devastating effects of increasingly draconian and arbitrary government regulations aimed at containing the coronavirus.
While there was clearly fiscal and monetary expansion in the late 1960s and early 1960s under Presidents Johnson and Nixon, the degree of this coordinated expansion pales in comparison to what’s happened over the past few years and, indeed, what’s happening right now.
The US labor market was the strongest it’s been since the late 1960s in late 2019 and inflation remained low for most of the period from 2005 to 2021, much like the late 1950s and 1960s.
For much of the late 1960s and through the 1970s, the Fed was reluctant to accept the economic pain necessary to truly squash the inflation they’d created. Thus, while the central bank did tighten policy to bring down inflation in 1973-1974, the Fed then eased policy too quickly and by too much as the economy entered a deep downturn; inflation never fell below 4.9% year-over-year in late 1976.
That left the embers of inflation glowing as the 1973-75 recession ended – by the end of 1977, CPI was jumping at a 6.7% annualized pace once again. And, by the end of the decade, inflation was out-of-control, rising above 13%.
Something similar is likely to happen over the coming 5 to 10 years (maybe more).
While he’s talking tough on rates right now, I seriously doubt Jerome Powell, who fought for average inflation targeting in 2019 and cut rates aggressively when the stock market tanked in late 2018, is the man who will ultimately be able to quell the inflation he’s helped create. There are obvious parallels between Jerome Powell’s predicament today and that of Arthur F. Burns, who was Chairman of the Federal Reserve from January 31, 1970 until March 31, 1978.
One of the only asset classes that produced positive real returns in the 1970s was commodities and precious metals.
In the 1970s, the US and virtually all developed country stock markets lost money in real terms. So too corporate bonds, US Treasury bonds and bills.
Yet, wheat prices jumped 3.76% annualized AFTER adjusting for inflation, oil prices soared 19.23% annualized and gold was up 21.71% annualized.
Through the centuries, real assets have been used as an inflation hedge and a hedge against stagflation, economic turmoil and weak economic growth.
Generally, I believe the super cycle in commodities over the next several years could be breathtaking at times because these assets are tiny in comparison to the global equity and sovereign bond markets. That means relatively small shifts in asset allocations – managers reallocating even a few percentage points of portfolios from equities and bonds to commodities – can produce outsized price reactions.
In short, given my intermediate-to-long-term expectations for stop-go economic growth, and structurally higher inflation, one facet of my strategy in the model portfolio is to retain some overweight in commodity markets over the long-haul. Of course, it’s important to caution that commodity markets, like the stock and bond markets, do NOT move in a straight line higher.
There will be corrections, pullbacks and downturns along the way; however, unlike the stock and bond markets, those pullbacks will represent buying opportunities.
Real Rates and the Dollar
In the shorter term, two key factors that drive gold prices include real interest rates and the US dollar.
Unlike equities or bonds, gold doesn’t pay dividends or interest. That means there’s an opportunity cost to holding the metal – when you buy gold, you’re giving up the opportunity to earn dividends or interest in stocks and bonds respectively.
So, when rates and yields are high, that opportunity cost is more punitive, and holding gold is less attractive – in other words, gold prices tend to be inversely correlated to real (inflation-adjusted) interest rates, so that rising rates is negative for gold and falling rates is positive for gold.
And then there’s the dollar. Since gold is traded in US dollars, when the dollar weakens against other currencies around the world like the euro and yen that tends to be bullish for gold.
To evaluate the impact of these two forces, I use a simple multivariate regression model I’ve discussed before in this service. Using data since 1997, this model attempts to forecast the 5-week percentage change in gold prices (expressed in basis points) using the contemporaneous 5-week change in 5-Year US Treasury Inflation Protected Securities (TIPS) yields and the 5-week percentage change in the US dollar Index.
TIPS are a proxy for real interest rates and the US Dollar Index (DXY) monitors the performance of the dollar against a trade-weighted basket of major foreign currencies.
Over the weekend, I updated this model using the latest data and obtained this output:
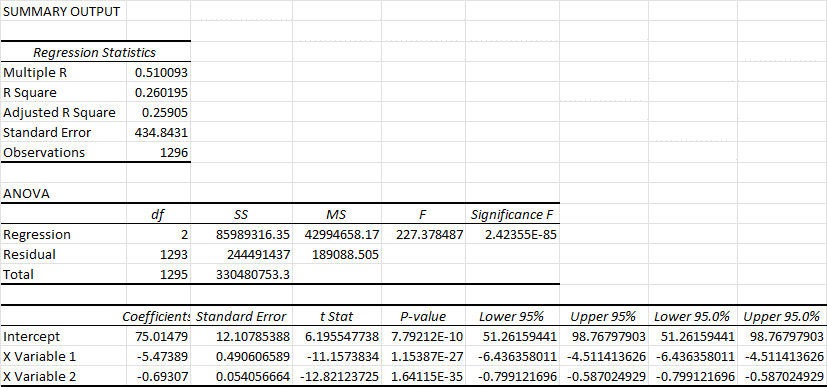
Source: Excel Regression, Bloomberg Data
I won’t go through what all of this means; however, here are a few highlights.
R-squared (R2), also known as the coefficient of determination, measures how much of the change in gold price can be explained using the regression model I created.
An R-squared value of 1.0 (100%) would suggest a perfect model and an R-squared of 0% would indicate no predictability. What I found is that if you simply regress changes in the price of gold against changes in real rates, the coefficient of determination is around 15% to 16%. Similar R-squared values can be obtained by regressing 5-week changes in the price of gold against the contemporaneous percent change in the Dollar Index.
However, if we use BOTH real rates and the dollar as independent variables in this regression, the R-squared value jumps to about 26.02%. While that’s still low in an absolute sense, creating models of this sort based on economic and financial market data typically yields relatively low R2 values. In short, an R-squared value of 26% suggests the model has significant value.
Second, the t-test stats in the table above indicate that both real rates and the dollar index are statistically significant drivers of changes in gold prices. There’s well under 1% probability that the relationships are due solely to chance.
The equation derived from this regression is as follows:
Gold = (-5.47389 * DXY) + (-0.69307 * TIPS) + 75.01479
Where Gold, DXY and TIPs are the 5-week changes in prices measured in basis points (1/100ths of a percent).
Let’s plot the actual and modeled price of gold over the past two years:
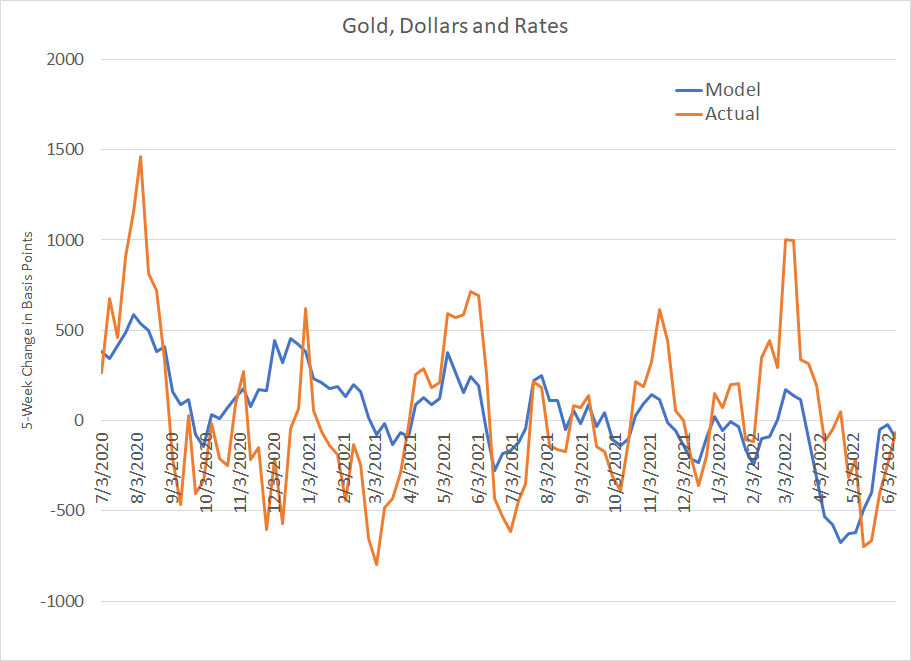
The blue line represents the modeled 5-week changes in gold prices while the orange line represents the actual changes in the price of gold.
Just eyeballing the results, I’d say the amplitude of gold price swings is higher and more extreme than what’s projected by the model but it’s still useful in describing directional changes in gold prices. In other words, when the model line rises in the chart above, gold tends to rise as well. albeit by a larger magnitude than the model anticipates.
Now here’s where this model gets interesting.
Over the past 23 weeks – from the week ended January 7, 2022 to the week ended June 10th 2022 inclusive– this gold model has projected a 5-week decline in gold prices 18 times (about 83% of the time). However, gold has risen more than 52% of the time over this same period.
If we use the actual price of gold and the modeled changes since late 2021, the model says the price of gold today should be around $1,766.50/oz. compared to the actual price of $1,871.60 as of Friday’s close. In addition, the modelled price shows gold trading down to the $1,660 range back in April and no higher than about $1,815 this year; gold has never closed below $1,780 this year and traded above $2,070/oz. back in early March.
Put in a different way, with real interest rates rising sharply in 2022 – 5-Year TIPS yields have soared 175 basis points – and the Dollar Index up sharply and trading close to 20-year highs in mid-May, you might expect gold prices to be plunging in 2022. They’re not; in fact, the SDPR Gold Shares ETF (NYSE: GLD) that we use to track gold in the model portfolio is up about 2.1% year to date.
So, at this juncture, you might be wondering why I’m not recommending the sale of GLD from the model portfolio, given how the model I follow has been consistently bearish this year.
The simple answer is that’s not how I use models of this nature – it’s just too obvious.
You see, I am not the only one who has created a model of this sort using various inputs for real rates and the dollar, and the Fed’s current drive to raise rates is one of the most talked-about trends in 2022 – it’s obvious to everyone. Much the same can be said of the dramatic rise in the value of the dollar this year relative to key trading partners, particularly the Japanese yen.
And it’s not that these fundamentals have stopped working – for example, a particularly sharp drop in real interest rates from February 10th to March 8th did correspond to the big spike in gold prices this year to well over $2,070/oz.
Rather, it’s clear that something else is driving gold and, in particular, other forces are cushioning the severity of gold price declines due to the powerful headwinds of rising real rates and a strong dollar this year.
Two final points on gold.
First, when a market doesn’t act like it “should” by, for example, rising when the fundamentals support a fall, it’s usually a sign the bad news is already priced in and the market is looking to a longer term improvement in the fundamentals.
In this case, it appears that gold prices at $1,800/oz – a magnet level for the commodity for much of the past 8 months – are low enough to have already factored in Fed rate hikes, rising real rates and a significant rally in the dollar. Investors now appear to be pricing in a longer-term return to a much more favorable fundamental environment for gold -- my best (educated) guess is that I’m far, far from the only one who sees the similarities between the current market and that of the early 1970s, and gold’s attraction as a hedge in a “stagflation” world.
Second, if gold can hold its own and even rally in the face of a hurricane-force rise in real rates and the dollar, imagine what could happen if either (or both) of these headwinds reversed later this year?
That’s not as implausible as it might seem at first blush.
For example, right now, the most obvious path for Fed policy is toward higher interest rates and higher real interest rates needed to bring down sky-high inflation. Indeed, there are even some calls out there the Fed might hike by 75 basis points instead of the expected 50 basis points this week at its meeting on June 15th.
However, when the economic data really starts to weaken later this year as a lagged side effect of rising rates, will the Fed maintain its fortitude?
History suggests they will not.
And while the dollar is strong now, the European Central Bank and other central banks around the world are also raising rates – could it be that the dollar’s rally cools or even reverses later this year? It certainly seems plausible to me.
If you enjoyed this piece, please do me a favor and click the heart-shaped “like” button below this post. This helps raise the profile of this free Substack service, so I can justify posting more frequently.
And, if you have any questions or comments, be sure to post in the comments section below. I plan to feature answers to common questions in upcoming posts.
DISCLAIMER: This article is not investment advice and represents the opinions of its author, Elliott Gue. The Free Market Speculator is NOT a securities broker/dealer or an investment advisor. You are responsible for your own investment decisions. All information contained in our newsletters and posts should be independently verified with the companies mentioned, and readers should always conduct their own research and due diligence and consider obtaining professional advice before making any investment decision.