


The Pain Trade
Maximum frustration for both bulls and bears

Over the weekend, the cover of Barron’s magazine declared “This Market has Legs,” and featured a dancing bull.
And just this morning I saw an article over on MarketWatch declaring the “S&P 500 exits longest bear market since 1948.”
I must admit, I had to do a bit of digging regarding that longest bear market claim. Having lived through both the 2000-02 and 2007-09 bear markets, I had the distinct impression those episodes felt far worse and more enduring than last year’s sell-off in the S&P 500.
As it turns out, the favored definition of a bull market in the mainstream financial media these days is a 20% rally in the S&P 500 from a low based on closing prices. The S&P 500’s closing low on October 12, 2022, was 3,577.03, which means you’d need a close above 4,292.44 to declare a new bull market and last Thursday’s close was 4,293.93, so there you go.
This, apparently, brought the bear market that started in early January 2022 to a close.
By that definition, there was no 2000-02 bear market in the S&P 500 – the 20% bulls would tell you the S&P 500 exited the bear market that started in March 2000 in early December 2001 and entered a new bear market shortly thereafter. That bear market then ended in August 2002 even though the market made new lows in October 2002 and came close to retesting those lows in early 2003.
The same sort of mathematical machinations “created” two bear markets between 2007-09 and, apparently, each of those was shorter in duration than the bear just ended.
Never mind the credit crunch and Great Recession of that era represented arguably the worst economic environment since the 1930s, or that the unemployment rate reached 10% in 2009, or even that investors who bought the S&P 500 when the bear market “ended” on December 8, 2008 watched their portfolios lose about 25% over the ensuing 3 months. It’s all about that magical 20% close.
As you’ve probably gathered, I have little regard for bull, or bear market definitions of this sort.
Among other issues, setting an arbitrary hurdle based on percentage changes in the S&P 500 ignores the fact market volatility has changed over the past 75 years, and the current reality that the S&P 500 has rarely been more concentrated in just a handful of components.
Just consider:
Source: Bloomberg
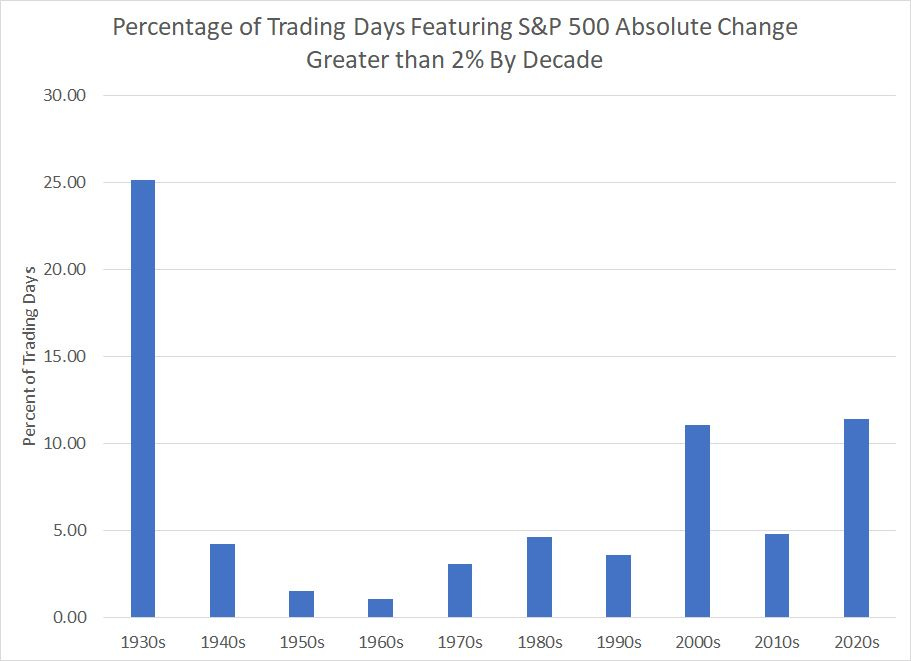
I looked at daily price changes in the S&P 500 since the end of 1929 and this chart shows the percentage of trading days each decade where the S&P 500 rallied or fell by more than 2%.
As you can see, big daily moves in the S&P 500 just aren’t as rare as they used to be – in the 60’s the S&P 500 rose or fell more than 2% on just 1.08% of all trading days compared to 3.09% of trading days in the 70s and 11.05% in the aughts (2000s).
Indeed, so far this decade the S&P 500 has experienced swings of 2% on 11.42% of all trading days; it’s early yet, but should this pattern continue, the S&P 500 that would rank the 2020s as the most volatile decade on this basis since the Great Depression years of the 1930s.
So, I ask you:
Do you really think a 20% rally, or selloff, in the volatile 2020s, 2000s or 1930s carries the same meaning as a 20% sell-off amid the placid trading of the 1960s?
In my view, that’s inane:
Bull and bear markets are a function of the economic cycle, NOT one-size-fits all percentage rallies or sell-offs.
And just consider the simple logic of the matter. I’d argue defining a bear market as a peak-to-trough decline of 20% or more in the S&P 500 makes at least a modicum of sense; after all, there have only been 2 cycles since the 1940s where the S&P 500 has slumped that much without a US recession.
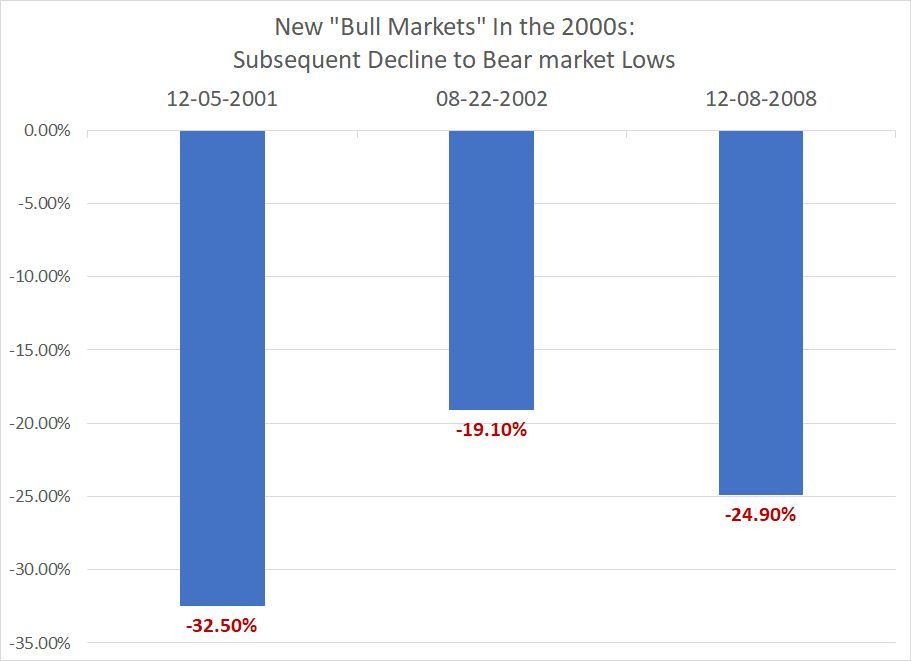
However, a quick glance at the 2000s – the last decade approaching the 2020s in terms of big daily swings in the S&P 500 – shows the folly of declaring a 20% rally off the lows as a new bull market.
I suspect 20% rally bulls who bought the S&P 500 “bull markets” that started on December 5, 2001, August 22, 2002, and December 8, 2008 regretted that decision as the market went on to sink to fresh new bear market lows on each occasion:
Source: Bloomberg
Last week did, however, bring some changes that I believe could ultimately be more impactful than Thursday’s close more than 20% above the October lows.
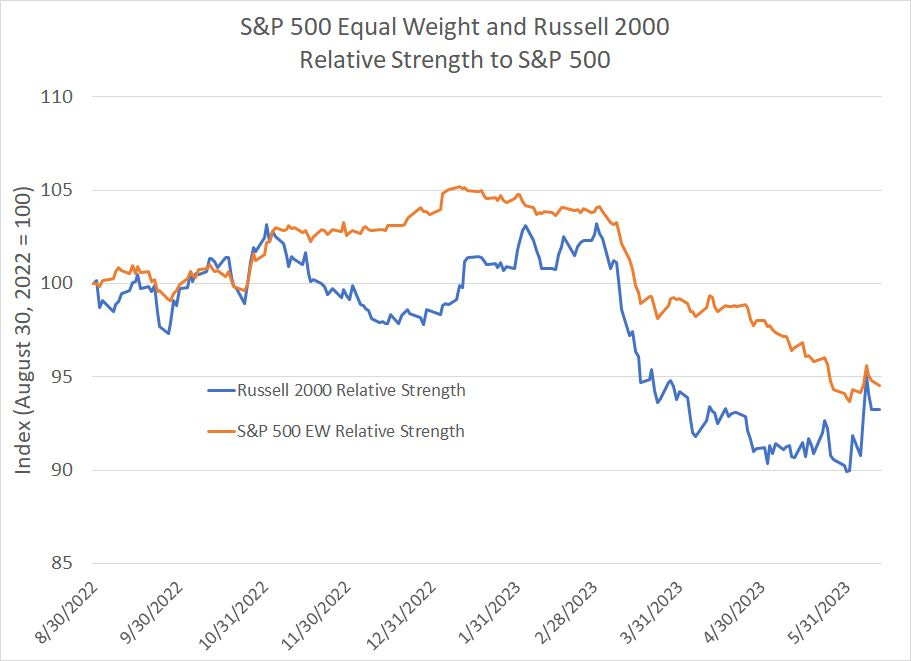
Specifically, for the first time in 7 weeks, the S&P 500 Equal Weight and Russell 2000 managed to outperform the S&P 500 and the S&P beat the Nasdaq 100 last week. To be fair, that’s done little to improve the market’s terrible breadth or increased dependence on a handful of large-cap tech and growth stocks since early February:
Source: Bloomberg
However, particularly for the Russell 2000, the violence of the reversal to the upside through the middle of last week looks like a sort of warning shot for investors and I believe we need to make some adjustments to the model portfolio accordingly.
The Pain Trade and FOMO
It’s often said the stock market will seek to frustrate the maximum number of people as often as possible.
I’ve written about the importance of market sentiment in forecasting short-to-intermediate term moves in markets before. The idea is simple – when most investors are leaning bullish, that usually means a lot of good news is already priced in markets, leaving high potential for disappointment and a correction. The opposite is true when sentiment is overwhelmingly bearish.
Overall, there’s evidence in data on S&P 500 futures commitments and Bank of America’s monthly Global Fund Manager’s Survey that investors have remained pretty bearish on stocks despite the rally so far this year.
The odd quirk is something I’ve written about on a few occasions – while investors are bearish on many parts of the market, there are pockets of extreme optimism including in technology, themes like artificial intelligence and the Nasdaq 100. Indeed, in last month’s Bank of America survey of institutional investors, the most crowded trade was “Long Tech” even as investors held a larger than average cash position and were bearish on stocks relative to bonds.
So, I’d argue the pain trade – the trade that could frustrate most investors – would be for those crowded, over-owned market sectors (tech and the Nasdaq 100) to weaken while the market broadens out to embrace still-hated small caps. We saw the first shot across-the-bow last week when the Russell soared 2.7% on Wednesday, a day when the Nasdaq 100 fell on the session.
On Tuesday this week, the Nasdaq 100 closed higher by about 0.77%, while the Russell 2000 was up 1.15%.
There are also signs retail investors are beginning to embrace the rally and the so-called Fear of Missing Out (FOMO) trade:
Source: Bloomberg
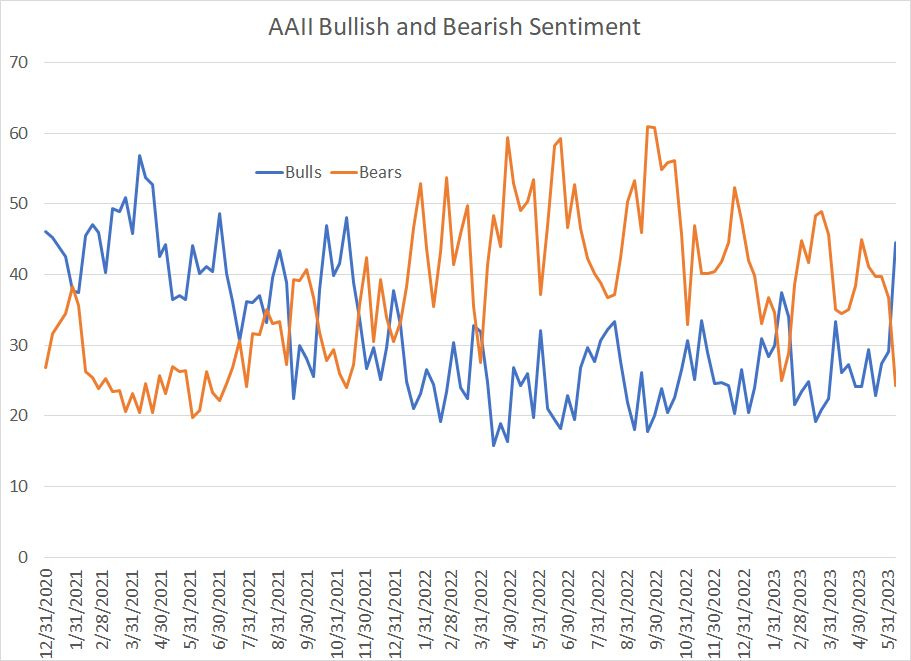
This chart shows the weekly results of a survey conducted by the American Association of Individual Investors (AAII). In the latest survey, the portion of investors bearish on stocks over the next 6 months slumped to 24.3%, the lowest since mid-November 2021.
Similarly, the portion of bulls in the survey (blue line) soared to 44.5%, the highest reading since that same week in November 2021.
The broader S&P 500 continued to rally for almost 2 full months after that surge in bullish sentiment in November 2021; however, that signal flashed red just about a week before the Nasdaq 100’s all time peak on November 19, 2021.
Individual investors often focus significant attention on momentum favorites and stocks that are widely covered in the mainstream financial media. That would include the Nasdaq 100 and stocks like Apple (NSDQ: AAPL), Microsoft (NSDQ: MSFT) and Nvidia (NSDQ: NVDA) in recent years.
So, I suspect the surge in bullishness apparent in the latest AAII survey reflects strong performance from these momentum darlings so far this year. There’s risk excess optimism for these favored stocks could bring about a top in over-owned momentum names this summer just as it did back in November of 2021.
Of course, timing is the thing – none of this means the market will top this week or even this summer, or that small caps’ dismal performance will improve soon. However, I do believe there’s heightened risk of vicious sector-and-style rotation this summer that could catch these newly minted bulls on the wrong side of the market.
Such “pain trade” market rotations have been a regular feature of the stock market in the 2020s.
In the last issue I outlined a three-pronged approach to the current market environment including looking for pockets of value outside the momentum favorites like Nvidia (NSDQ: NVDA) and holding a significant cash position to take advantage of opportunities in coming months.
This week, I’m making 5 additional adjustments to reflect this strategy including the addition of exposure to a market than just made a new 33-year high and actually benefits from resurgent global inflation and a major planned increase in capital returned to shareholders:
Actions to Take
Here’s a quick rundown of the changes I’m making to the model portfolio:
Keep reading with a 7-day free trial
Subscribe to The Free Market Speculator to keep reading this post and get 7 days of free access to the full post archives.