

The Stealth Bull Market
The Stealth Bull Market
Something important has shifted since October 14th...

In 2021, the S&P 500 soared 28.7%, its fourth-best showing of the prior 25 years.
Yet just underneath that cheery façade, a stealth bear market started in mid-February:
Source: Bloomberg
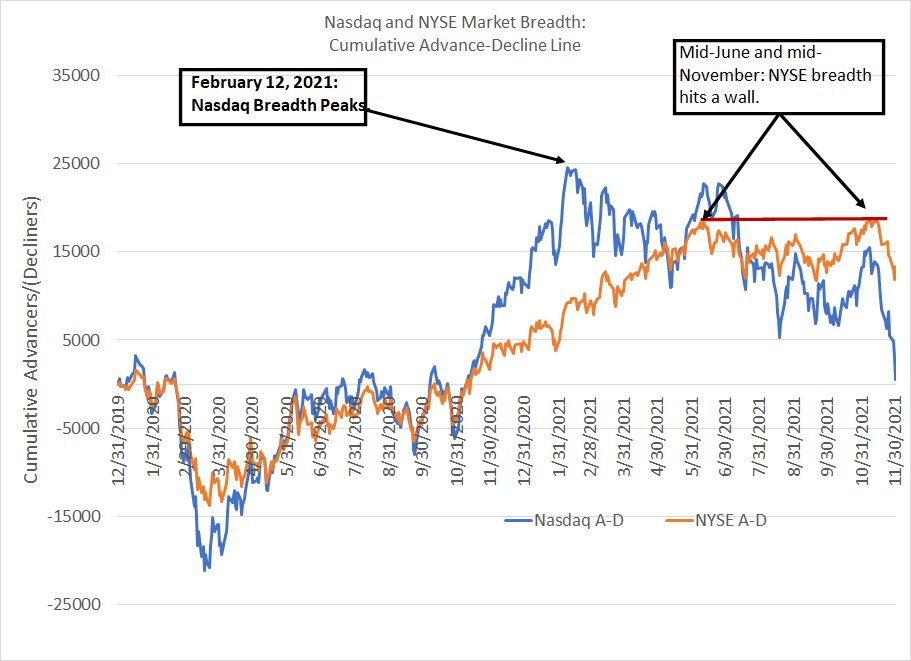
This chart shows the Cumulative Advance-Decline line for the Nasdaq in blue and for the NYSE in orange from the end of 2019 through the end of November 2021.
The calculation of the A-D line is simple: Each trading day you calculate the number of stocks rising in price (advancers) and subtract the number of stocks falling in price (decliners).
Then keep a running total of each day’s advancers minus decliners total added to the cumulative sum of previous days. For the sake of simplicity, I’ve started this running cumulative total at zero on December 31, 2019 – a rising line means there are more individual stocks rising in value than declining in value and vice-versa.
At first blush, you might think you can tell the market is rising simply by looking at the performance of the S&P 500 or the Nasdaq 100; however, the major US indices are increasingly dominated by just a small handful of mega-cap behemoths.
Right now, for example, the 10 largest stocks in the S&P 500 have an index weight of 26% and the top 25 have a weight close to 43%. Thus, strength in 10 to 20 large-cap names can mask weakness in most stocks.
That’s exactly what happened back in 2021.
The S&P 500 didn’t peak until early 2022; however, NYSE breadth measured in terms of the cumulative A-D line hit a high in mid-June 2021, retested that high in mid-November and then fell into early 2022.
The situation for the growth and tech-heavy Nasdaq was even worse – Nasdaq’s A-D line hit a peak on February 12, 2021, and then trended lower for the rest of the year, plummeting in November-December of that year.
Just consider: From February 12, 2021 through December 31, 2021, the Nasdaq Composite returned a healthy 11.7%, hardly what anyone would call a bear market. However, less than 38% of the roughly 2,700 traded on Nasdaq actually delivered positive returns over this time period and the average stock tumbled 14.4%. More than 48% of the stocks on Nasdaq dropped more than 20% over this time frame.
Does that sound like a bull market to you?
Tracking market breadth is useful because it tends to lead tops in the major indices – historically, late-stage bull markets grow narrower over time, with fewer and fewer issues supporting the upside. That shows up in the form of a decline in the A-D line even as the major indices continue their advance.
The stealth bear market in 2021 ended with the 2022 collapse as the erstwhile large-cap leaders, particularly tech and growth favorites, finally succumbed to the selling pressure, dragging down the major averages.
Today, we have a nascent stealth bull market underway:

Source: Bloomberg
This chart shows the Cumulative A-D lines for the Nasdaq and NYSE since the end of 2021; I’ve rebased the A-D lines to start at a value of zero on December 31, 2021.
As you can see, the NYSE line in orange looks much healthier than the Nasdaq line in blue. NYSE breadth made a low last year on October 14, 2022, and broke above its December highs earlier this month. Meanwhile, the Nasdaq A-D line made a low on October 14th, bounced for a few weeks, and then set a lower low on December 28th, right at the end of 2022.
The Nasdaq A-D line has recovered this month; yet, it’s still weak in relation to the NYSE line, and more or less in line with where it was trading in mid-December.
So, I don’t see much room for optimism in terms of Nasdaq breadth, but there does appear to be an effort to put in a low on the NYSE. Indeed, the S&P 500 is up more than 10% since the close on October 14th while the Nasdaq 100 is up just 7.6% and the Nasdaq Composite is up less than 7%.
Of course, many of the same stocks that dominate the Nasdaq 100 also dominate the S&P 500 – both indices are weighted by market cap (firm size). Instead, if we look at the equal-weight version of the S&P 500, where all stocks have an equal weight in the index, that index is up an impressive 13.7% since October 14th, outperforming the broader market by more than 3.5% over just over a 3-month period.
I examined the 2,600 largest stocks in the US, traded on NYSE and Nasdaq, and 74.7% of those are trading higher than they were on October 14th while almost one-third are up more than 20%.
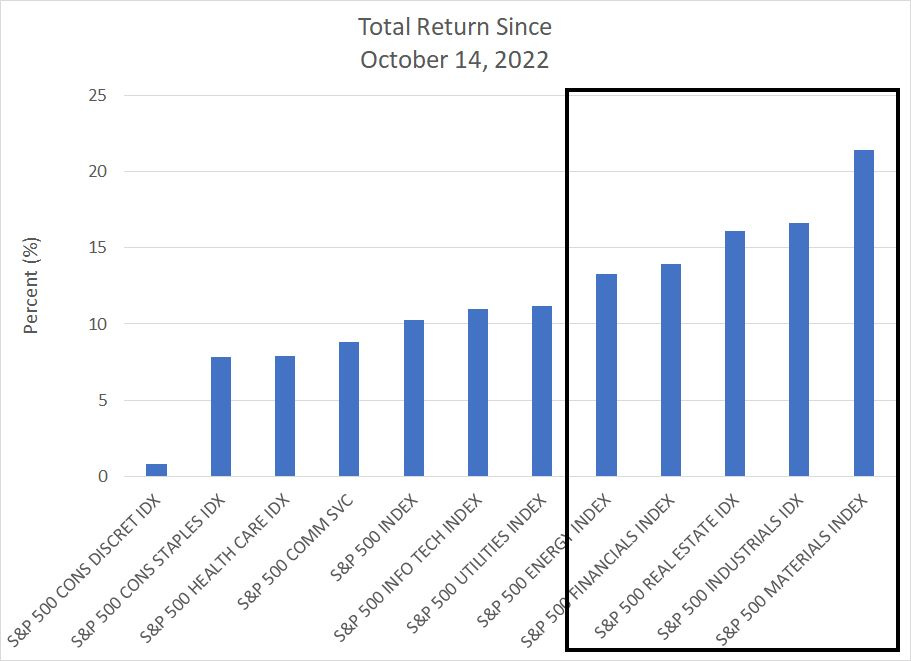
And let’s look at a sector-by-sector breakdown in performance since October 14th:
Source: Bloomberg
As you can see, strength in the S&P 500 since mid-October has been led primarily by cyclical industries like Materials, Industrials, Financials and Energy. Of course, with the exception of Materials, these are all groups that were laggards amid the 2020-2021 rally, which was dominated by the S&P 500 Information Technology and Consumer Discretionary sectors.
Note: Amazon.com (NSDQ: AMZN) and Tesla (NSDQ: TSLA) are both consumer discretionary stocks per S&P classification, and these two names alone account for more than 35% of the S&P 500 Consumer Discretionary index.
So, this trend is young, since breadth has only been improving for the NYSE since mid-October and the Nasdaq isn’t benefiting much from the upside. However, there is something of a stealth bull market underway right now and that’s helping support the overall rally we’ve seen in the broader market since late last year.
This phenomenon also explains why you may have heard talk of a so-called “breadth thrust” in recent days. The idea here is that historically major advances in the stock market are preceded by a surge in positive market breadth; definitions of what constitute a bullish breadth event differ, but some popular definitions have signaled over the past two weeks.
The fact the leaders of the recent advance are primarily stocks that lagged in the 2020-21 rally and, even more important, through the 2009 – 2021 bull market, is completely normal. That’s because bear markets, especially those accompanied by recession and/or inflation surges, tend to bring about changes in market leadership that last for years.
I believe that’s exactly what’s underway right now and that view is supported by some of the valuation work I covered in the January 5th and 10th issues of The Free Market Speculator titled “The Most Powerful Indicator of Long-Term Market Returns” and “In the Long Run, We’re all Dead” respectively.
So, you might be wondering, does that mean that the bear market is over?
Recessions, Bear Markets and Stocks
Historically, the stock market does not peak more than a year before the start of a recession.
The stock market is a leading indicator for the economy – that’s because it tends to turn lower as investors anticipate economic weakness ahead. In this cycle, the S&P 500 peaked on January 3, 2022, a little more than a year ago while the Nasdaq 100 hit its peak on November 19, 2021.
Yet, here we are more than a year later, and it doesn’t look likely the US is in recession right now, though I continue to look for the economy to slide into a downturn by the middle of this year.
So, the stock market appears to be further ahead – more “leading” if you will – than normal in this cycle.
That’s similar to what happened back in 2000 –the S&P 500 peaked in March 2000 but didn’t enter recession until a year later in the spring of 2001. The reason is that the bear market of 2000-02 was actually driven by two factors: The economic cycle (recession and a drop in corporate earnings) and the deflation of an epic bubble in technology and the Nasdaq.
The bubble burst first in 2000, even though the US economy still looked rock-solid at the time. Then the second economic growth scare “shoe” dropped in 2001 when the economy weakened enough, and broadly enough, to be considered a recession.
In this cycle, we have a similar set-up. The bubble was caused by the Fed’s increasingly aggressive monetary accommodation over the 2009-2022 era and historic lows in rates. Indeed, Bank of America did a study of interest rates dating back 5,000 years – using written records from ancient Mesopotamia, for example – and determined in recent years interest rates reached the lowest levels in 5,000 years!
Low rates pumped up a bubble in long-duration growth stocks and, when inflation finally forced the Fed to raise rates, that bubble popped. To make matters worse, the coordinated fiscal and monetary expansion starting in early 2020, amid the initial COVID outbreak, served to supercharge the bubble and rendered the ultimate adjustment more dramatic.
So, that’s what drove the selling last year – the deflation of the growth and easy credit bubble amid rising rates, something I covered in The Free Market Speculator back in October “Further Downside Ahead for Stocks.”
Some stocks have been largely unaffected by these shifts to date:
For example, over the past year, the Russell 1000 value index is down just 3.3% compared to a 21.7% plunge in the Nasdaq 100 over the same time.
However, the market has only grappled with the interest rates and inflation issues to date – given the resilient performance of more cyclical value groups over the past year, I suspect markets have only just begun to price in the realities of the economic downturn, and the corporate earnings recession, that’s just around the bend.
The 2000-02 Breadth Experience
Just consider, in the 2000-02 cycle, the Russell 1000 Value Index hit a fresh high in late May 2001 – that’s a full 14 months AFTER the S&P 500 peaked and two months after the start of the recession.
And, have a look at this chart:
Source: Bloomberg
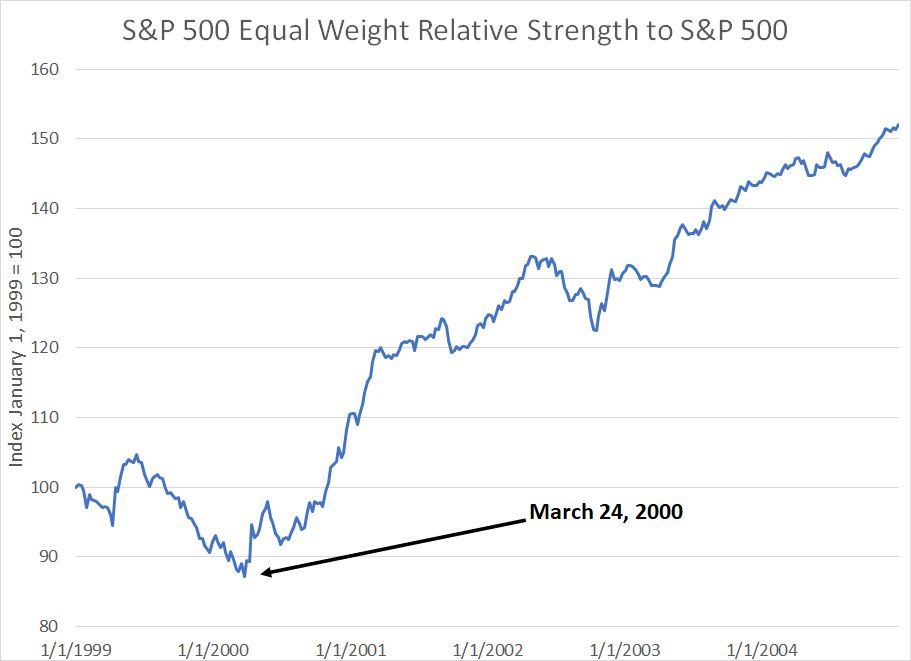
Here’s a chart showing the relative strength of the S&P 500 Equal-Weight Index compared to the S&P 500 – it’s a measure of market breadth as well. Generally, when this line is rising, it signals the average stock in the S&P 500 is performing better than the largest stocks in the index.
This chart covers the period from January 1, 1999 through the end of 2004.
As you can see, the late 90’s bull market lacked breadth, much like the rally that led up to the 2021-22 peak – that move was driven by a small, and narrowing, cadre of issues.
This ratio bottomed as the stock market peaked in 2000 and rallied straight through the subsequent bear market that saw the S&P 500 decline by almost 50%.
That’s because, just like today, a large number of stocks that lagged the prior bull market started to outperform – these erstwhile laggard stocks did become the leaders of the 2002-07 bull market, though they saw declines in absolute terms in 2001-02 as the economy slipped into recession and saw a mediocre subsequent recovery.
Bottom line, I have three conclusions:
1. The recent surge in breadth could certainly continue a bit longer and drive some additional market upside – bear market rallies are a feature of every cycle in history I’ve studied – however, just because breadth is improving does NOT mean the market has bottomed (that happened in 2001-02 as well and the market continued to fall)
2. The main driver of stock market losses over the past year has been the deflation of the easy money growth bubble of 2009-2021, but stocks have only just begun to price in the realities of the coming economic storms – just like 2001, I continue to expect a next leg of the bear market later this year.
3. As I’ve written before, I suspect the recent market bounce is driven more by investor positioning than any other factor – sentiment became bearish in the final months of 2022 and institutional investors raised cash in a defensive mode. That idle cash is likely what’s driving this bounce though, if history is any guide, just as “the crowd” begins to embrace strength in equities, the market is likely to take a turn lower.
DISCLAIMER: This article is not investment advice and represents the opinions of its author, Elliott Gue. The Free Market Speculator is NOT a securities broker/dealer or an investment advisor. You are responsible for your own investment decisions. All information contained in our newsletters and posts should be independently verified with the companies mentioned, and readers should always conduct their own research and due diligence and consider obtaining professional advice before making any investment decision.