

The False Triumph of Alternative Energy Part 1
The False Triumph of Alternative Energy Part 1
Issue #1 of Myths, Half-Truths and Misinformation

Editor’s Note: This week I’m launching an occasional series for The Free Market Speculator called Myths, Half-Truths and Misinformation.
Over the past 25 years I’ve heard a ton of myths and misleading half-truths regarding financial markets. Many are benign though others are expensive, dangerous or lend investors a misplaced sense of confidence in a risky market view.
In this series, my goal will be to present a common, oft-repeated market or economic myth and explain, in the simplest terms possible, why it’s untrue, misleading or dangerous.
If you’d like to suggest or propose a topic for me to cover in this series, drop a comment using the link below:
This week, the focus is on renewable and alternative energy.
It’s a long piece, so I’ve decided to divide it in (at least) two parts — this is Part 1 and you can look for Part 2, titled “Europe’s Renewable Energy Crisis,” to be released over the next few weeks.
You’ve probably heard or read statistics like this:
“In Europe, wind and solar accounted for 22% of electricity generation last year overtaking for the first time the share of gas…”
— The New York Times January 31, 2023 “The Shift to Renewable Energy is Speeding Up”
Or maybe you’ve seen Tweets, or posts on social media, like this one with more than 2 million views:

Or how about this “Fact of the Week” from the US Department of Energy:

Source: Department of Energy Office of Energy Efficiency and Renewable Energy January 23, 2023
Let me start by saying these statistics are all technically true — it’s just that under even the most cursory examination these facts are largely meaningless. Even worse, the agenda being pushed between the lines is dangerous and misleading.
After all, it’s only natural to read a headline like “Portugal is getting 97% of its power from renewables” and think renewables must be close to replacing fossil fuels like natural gas and coal as sources of electricity.
And, to make it even better, this tweet would have us believe Portugal is managing this environmentally friendly feat while driving DOWN costs!
Per the tweet above, electricity costs just 4 euros (about $4.35) per megawatt-hour in Portugal. That’s low when you consider the lowest cost of electricity in Texas in the last 12 months was $22.25 MWh on November 7, 2022.
Alternatively, one might read a headline about Europe generating more electricity from wind and solar than natural gas and wonder why disruption of natural gas imports from Russia even matters.
Maybe those crafty Europeans have wisely invested in renewable energy, eliminating their need to import natural gas or coal, achieving independence from Russia and the Middle East, all while slashing carbon dioxide emissions and cutting costs, right?
To read this you might even be tempted to think there is no European energy crisis — it must all be a lie perpetrated by those evil ne’er-do-wells at Big Oil companies.
Well, here’s the problem:
Balancing the Grid
There’s extremely limited electricity storage capacity in markets like the US and Europe, so the electric grid must be balanced. Simply put, that means the supply of electricity generated and fed into the grid must equal the demand for power from homes and businesses on a moment-by-moment basis.
If the grid is not balanced properly, the result is electricity blackouts.
How small is electricity storage capacity you might ask?
Well, according to the US Energy Information Administration (EIA) total utility-Scale battery storage in the US was 7.8 gigawatts as of October 2022 and is expected to grow to around 30 GW by the end of 2025.
Pumped hydroelectric storage is an older means of storing electricity. Simply put, electricity generated when demand is low can be used to pump water from a reservoir at a lower altitude to a reservoir at a higher altitude. When there’s demand for power, the water can be allowed to flow from the higher reservoir, through a turbine to the lower reservoir to create power.
Total pumped hydro storage capacity in the US has been constant at about 23 GW for years and is limited by available water resources. About half of US pumped storage capacity was built in the 1970’s.
(If that sounds like a lot of storage to you, consider that total US electricity generating capacity is expected to grow to around 1,250 GW by 2025.)
Balancing the grid with such limited storage capacity means that when demand for power rises, generation must increase to feed additional electricity into the grid and balance supply with rising demand. And, of course, when demand for electricity falls relative to the amount being generated and fed into the grid, the grid operator must reduce supply, a process known as curtailment, to maintain balance on the grid.
And since there’s no cost effective, large-scale means of storing power, large amounts of electricity generated when there’s not enough demand must simply go unused.
With traditional fossil fuel and nuclear power plants achieving this balance is relatively simple. Typically generation capacity will include baseload power plants like nuclear and coal-fired facilities that are designed to feed a consistent amount of power to the grid for prolonged periods of time. For example, the US fleet of nuclear reactors typically generate an average of more than 90% of maximum nameplate capacity over the course of a year.
To supplement this base level of electricity and meet spikes or lulls in demand, operators can make use of “peaking power,” typically gas-fired generators that can be turned off or on quickly, changing the amount of power available to the grid.
The problem is this:
Intermittent Renewables
Unlike coal, gas or nuclear facilities, the power output from renewable energy projects is intermittent, varying significantly based on atmospheric conditions.
If there’s steady wind in a particular region, wind turbines will likely operate at close to maximum capacity, and the grid operator will need to reduce power generated from other sources like natural gas to keep the grid balanced.
(Obviously with solar, light levels vary based on cloud cover, and due to the Earth’s pesky habit of rotating on its axis every 24 hours).
Renewables’ inherent intermittency creates plenty of headaches for grid operators. After all, in a healthy modern economy, you can’t exactly tell consumers and businesses they won’t have power by evening because the wind is calm, and after sunset there won’t be enough photovoltaic output to meet demand.
So, with limited capacity to store electricity, most countries turn to what’s known as shadow capacity to supplement renewables. Simply put, that means they’re maintaining coal and gas-fired plants that can feed power into the grid when renewable output is inadequate to meet demand.
The higher renewables’ share of total generation, the more difficult the task of balancing the grid and maintaining reliability. The task is made even more difficult in countries like Germany that have simultaneously encouraged rapid development of renewable power capacity while actively closing traditional coal and nuclear baseload capacity.
So, with these points in mind, let’s turn back to some of the statements and “facts” I outlined earlier on in this issue:
Lies and the Tyranny of Averages
Early on in this piece I highlighted a Tweet from January 16th indicating that Portugal was getting 64% of its power from wind and 97% from renewables, sending power prices tumbling to just 4 euros per megawatt-hour.
So, let’s take a look:
Source: Bloomberg, ENTSO-E
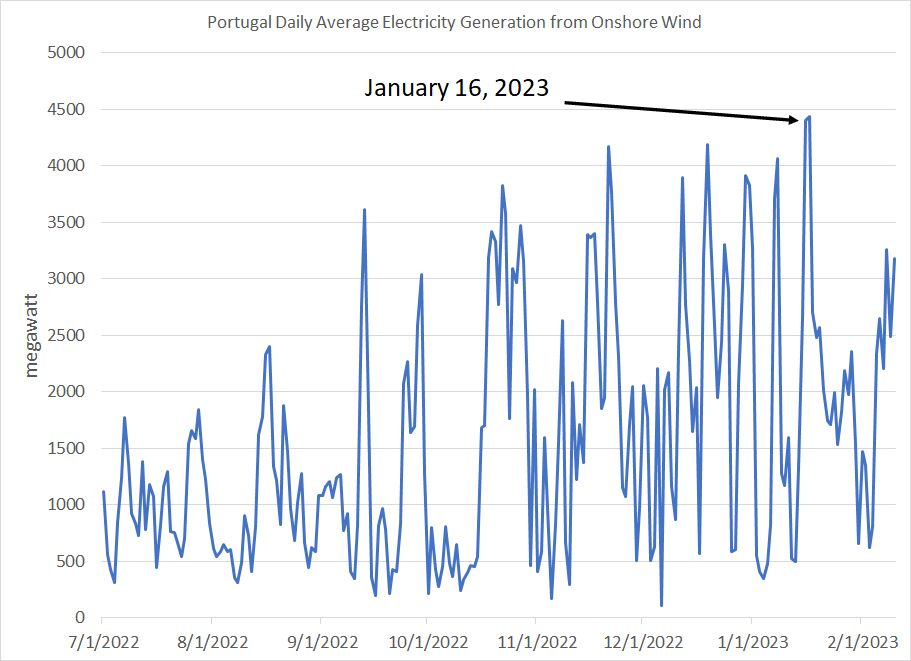
Virtually all Portugal’s wind generation capacity is located onshore, so this chart shows the daily average output from Portugal’s onshore wind turbines.
I’ve labeled January 16th and, as I said from the outset, the tweet I quoted is technically true — Portugal generated an average of 4.401 GW of power from wind on January 16th. On the same day, total average daily Portuguese power generation was 8.0875 GW, so a bit of simple math shows onshore wind accounted for 54.42% of average generation on that day.
(Yes, I know the tweet says 64% of Portugal’s power from wind — that’s based on hourly data at the time this tweet was sent, an issue I’ll cover in more depth a little later.)
First, let’s consider all sources of power generation on that same day:
Source: Bloomberg, ENTSO-E
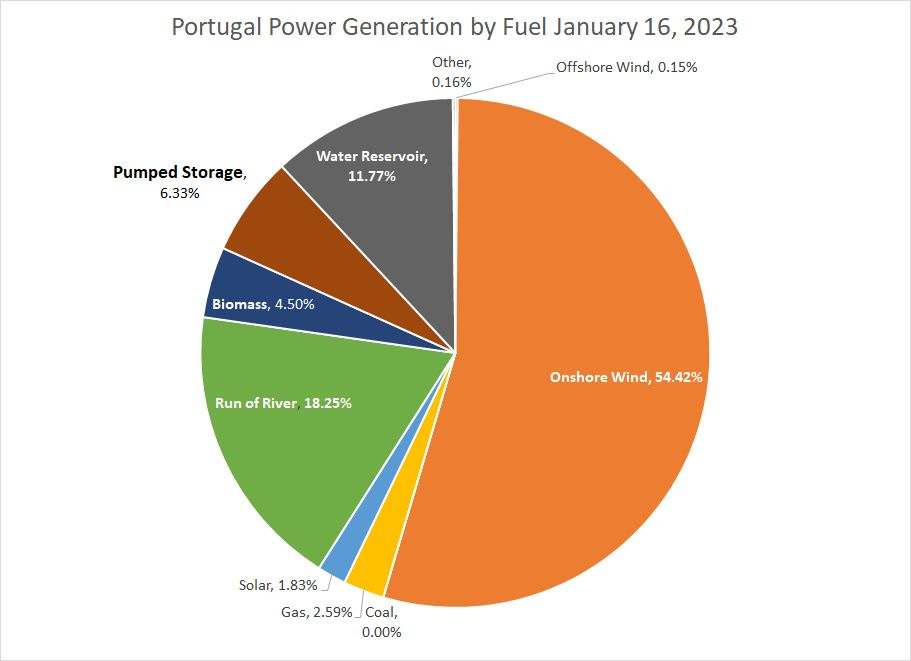
Here’s a quick pie chart showing Portugal’s Power Generation on January 16, 2023 on a daily average basis, broken down by fuel type.
As I’ve already explained, onshore wind was the largest source of power than day. If we add up the three sources of hydroelectric power — run of river, seasonal reservoir generation and pumped storage — then hydro accounted for around 36% of total power generation.
Tot up hydro, wind, solar and biomass and Portugal obtained more than 97% of its power on January 16th from renewable energy sources.
The country has no nuclear plants and closed its last coal plant at the end of 2021 — natural gas was the largest source of power from fossil fuels at just 2.6% of total daily average generation.
At this point, you may have spotted the issue here — there are 365 days in a year and January 16th is only one of those days.
So, let’s take a look at the same pie chart from November 30, 2022:

Source: Bloomberg, ENTSO-E
On November 30, 2022 wind velocities across Portugal were low, so average daily power output from the nation’s onshore wind turbines fell to less than 13.5% of total generation on that day. Total hydro generation was around 35.2% of generation, leaving natural gas to fill the gap, chipping in a massive 45.15% of total power output.
And, let’s look at the same data over an even longer time frame, in a different way:

Source: Bloomberg, ENTSO-E
In this chart, I’ve looked at the relative daily generation from Portugal’s Big 3 power sources since the end of 2020. The blue area represents the relative contribution from onshore wind, the orange is natural gas and hydroelectric, including power from run of river, reservoir and pumped storage hydro, is depicted in grey.
Over the course of this 2+ year period, you can see natural gas is the balancing source of power for Portugal — when output from wind and/or hydro drops due to poor generating conditions, natural gas fills in to meet demand.
Seasonally, Portugal’s hydroelectric output tends to rise in the winter months, because the country gets most of its annual rainfall in the months of November through April. So, you can clearly see how the grey area of my chart expanded in early 2021, late 2021-early 2022 and again over the past three months.
In contrast, Portugal’s dry season is summer, so hydroelectric contribution to power demand usually shrinks in the May-September period. In particularly dry years — much of Portugal saw drought conditions in 2022 — hydro output can really get squeezed in the summer months.
Average wind speeds vary widely from day-to-day and you can see wind’s contribution to electric generation is volatile. Over the past two+ years wind’s maximum daily generation has ranged from a peak of over 4,400 megawatts on the aforementioned January 16th and 17th 2023, to a low of just 105.3 megawatts on December 6, 2022.
When hydro and wind output are strong, of course, Portugal needs less natural gas to meet electricity needs. That’s what happened back in mid-January when renewables accounted for some 97%+ of Portugal power output.
However, look at the period from April through October 2022 — generally weak hydro and wind generation forced Portugal to rely heavily on generation from its fleet of gas-powered facilities.
On October 16, 2022, for example, gas accounted for almost 70% of Portuguese power generation; the nation generated 447% more power from gas that day than it did from wind and hydro combined.
Bottom line: Highlighting days like January 16 and 17th, 2023 when hydro power is seasonally strong, and average wind velocities are high, while ignoring long periods such as the spring, summer and autumn of 2022, when Portugal relied heavily on gas, is misleading at best.
Unless Portugal’s populace is willing to go without power for long stretches of time, including the hot, dry summer months, the country still needs natural gas to keep the lights on.
Also, consider that renewables don’t necessarily generate the most electricity when it’s most needed.
A classic example: In the summer months, heatwaves are often caused by at atmospheric high-pressure system, which traps warm air near the surface of the Earth. Unfortunately, such systems are also generally accompanied by lighter winds and, therefore, reduced output from wind turbines.
So, wind turbines produce well below capacity at just the time when demand for electricity to run air conditioning systems rises.
And, let’s add one more layer of granularity:
Misinformation: It’s Night and Day
As I said, power grids must be balanced on a moment-by-moment basis, so the average “daily” generation from a particular fuel source also doesn’t provide the whole story.
Just consider:
Source: Bloomberg, ETSO-E
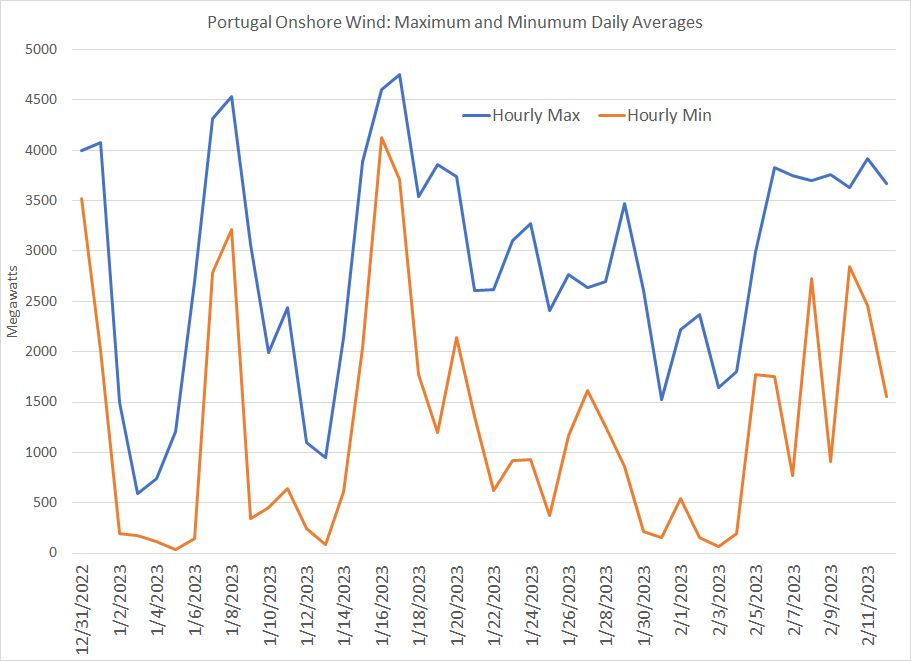
The European Network of Transmission System Operators for Electricity (ENTSO-E) breaks down electricity generation into hourly averages as well as daily averages. This chart shows the hourly maximum amount of power generated by Portugal’s onshore wind turbines and the hourly minimum foe every day since December 31, 2022.
For example, the average electricity generated by onshore wind on January 29, 2023 at 10 to 11 AM local time was 3,472 megawatts compared to just 863 megawatts from 5 to 6 PM on the same day. Thus, in the 10-11 AM period, Portugal generated very little — about 206 MW — from natural gas while, on the very same day, gas generation more than quadrupled to 849 MW by 5 to 6PM the same day as wind output fell.
Here’s the same chart showing the daily maximum and minimum output from Portugal’s gas facilities since the end of 2022:
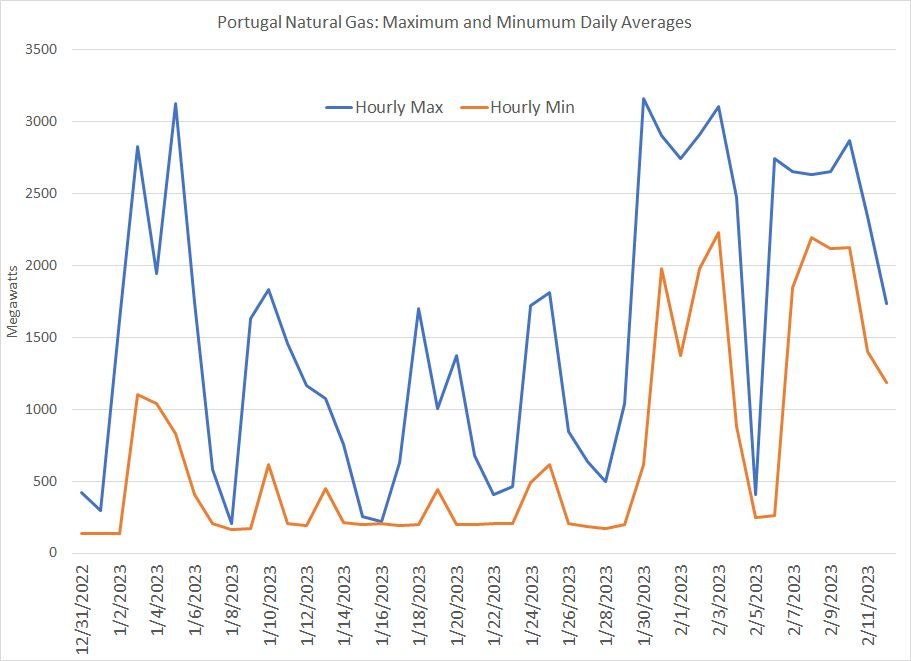
Source: Bloomberg, ENTSO-E
It’s not hard to see Portugal’s reliance on gas-fired power depends not just on the time of year, but also the time of day.
On January 30th, for example, gas generated just 614 MW from 4 to 5 AM and a whopping 3,156 MW from 8 to 9 PM the same day. Of course, it’s probable that total electricity demand in Portugal is far lower in those pre-dawn hours when wind power was abundant than in the early evening hours when gas turbines dominated generation on the grid.
And that brings me to this:
The Cost of Power
Like any commodity, the wholesale price of electricity is based on supply and demand.
When demand is high, the price of power rises to encourage more generation and maintain balance on the grid. Similarly, when there’s too much electricity supply relative to demand, the falling price of power is a price signal that encourages curtailment.
So, re-read that tweet about Portugal’s power costs above: Tweeting the price of power in a particular country is 4 euros per megawatt-hour “at the moment” tells you nothing other than, in the very short term, there’s copious supply of electricity, depressing prices.
Instead, let’s take a look at the longer term picture:

Source: Bloomberg
This chart shows the cost of peak power in Portugal on a day-ahead basis since the end of 2018.
Unfortunately, I don’t have access to intraday trading data on power prices for the country over this time period. However, once again, you can see the half-truth stated in the tweet at the beginning of this issue — yes, power prices were very low in mid-January (about 5 euros per MWh) because of heavy output from wind turbines in Portugal.
However, fast forward a month to mid-February and the price is closer to 150 euros per MWh, some 30 times its mid-January lows!
And, look back to March 7, 2022, a day when average wind speeds in Portugal collapsed and hydro output was weak, leading to a surge in demand for gas-fired generation, and a consequent spike in prices. On that day, the cost of power in Portugal reached 555 euros per MWh.
So, let me end part 1 of this piece with 3 key points:
Renewables’ contribution to total electricity generation varies significantly from season-to-season, day-to-day and even hour-to-hour, so statistics about the average contribution of intermittent power sources like solar and wind to total generation on a given date, or even for several weeks, months or years are largely meaningless. Cherry-picking generation stats from a windy day in January flatters the contribution from renewables.
Just because renewables account for 22% of total power generated in Europe doesn’t mean Europe is able to close down 22% of its nuclear and/or fossil fuel electricity generation capacity. That’s because at times during the year, renewables output collapsed due to atmospheric conditions, requiring significant fossil generation capacity to maintain balance on the grid. In short, a country must maintain (and pay for) significant gas-fired generation capacity to meet demand when wind and solar output are sub-optimal.
The spot price of electricity is a function of short-term demand and supply conditions in a particular market — depressed power prices when solar and wind generation is strong tell you nothing about the price competitiveness of renewable energy.