


The Truth About Stagflation
The reality of a "stop-go" economy...

Stagflation is a portmanteau of the words “stagnation” and “inflation.”
It’s a term most closely associated with the economic environment of the 1970s, and the idea that economic growth in that era was weak while inflation was high.
However, the “stagnation” part of “stagflation” is a myth:
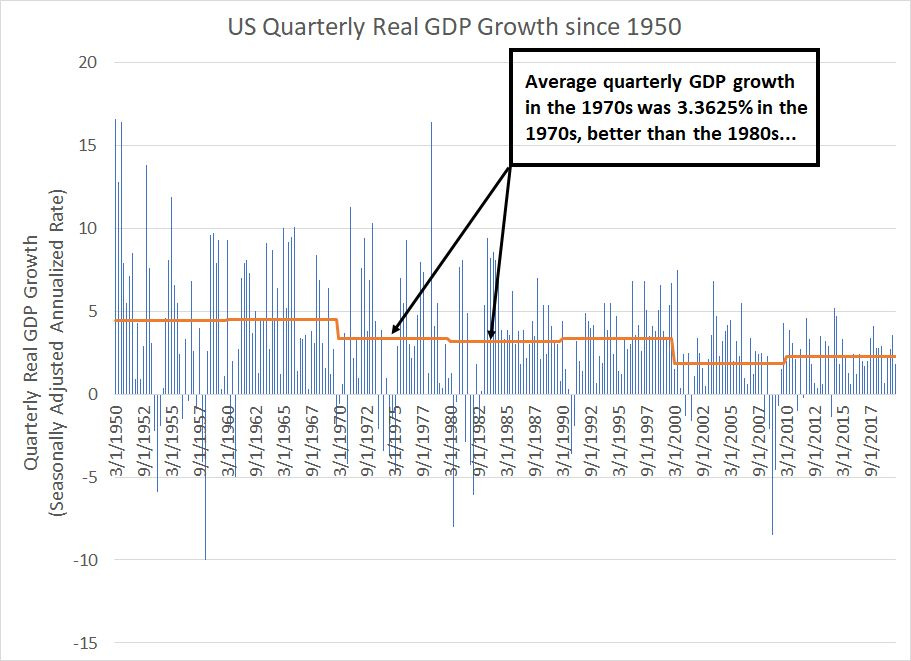
Source: Bloomberg
This chart shows quarterly US real (inflation-adjusted) GDP growth since the first quarter of 1950 with all figures expressed at a seasonally adjusted annualized rate (SAAR).
In the 1970s, the US economy grew at an average real pace of 3.3625% annualized. That’s less than the roughly 4.5% average annualized rate of the 1950s and 1960s, but it’s slightly higher than the average pace of growth in the 1980s at 3.1825%.
Further, real economic growth in the 1970s isn’t far shy of the 1990s at 3.3725% with the latter widely considered a sort of golden age for the US economy.
You see, the problem with the 1970s wasn’t so much that the economy was weak in real terms, it’s that the economic environment was so volatile:
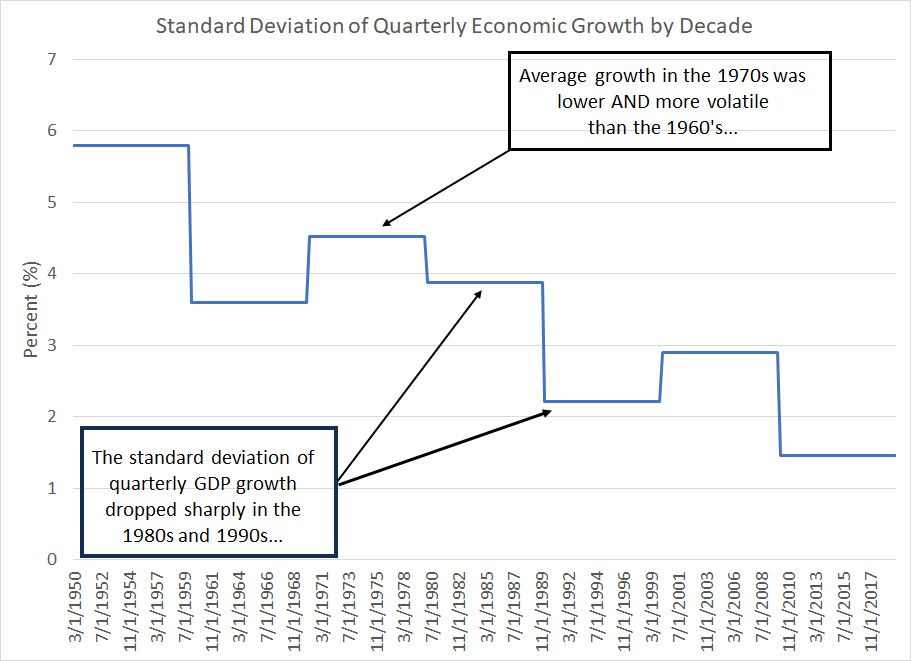
Source: Bloomberg
As you can see here, the standard deviation of quarterly GDP growth was much higher in the 1970s than the 1960s, even though average growth was significantly lower.
And while average growth in the 1970s was a bit higher than the 1980s and similar to the 1990s, you can clearly see the standard deviation of growth – the volatility of the economy – fell sharply in the 80s and even further in the 90s.
I suspect this phenomenon reflects the challenges presented by the second part of “Stagflation,” namely the elevated inflation rates the US economy experienced through the 1970s.
Inflation complicates economic and business decision-making by introducing noise into price signals. Normally, for example, when the price of a good or commodity rises, it incentivizes more supply from producers and helps quell demand. However, in an inflationary environment, it’s tougher to ascertain the meaning of price signals; rising prices could indicate higher demand or simply the loss of consumer purchasing power amid an economy-wide increase in price levels.
Heightened economic volatility in the 1970s also explains why this era is more accurately characterized as a “Stop-Go” economy:
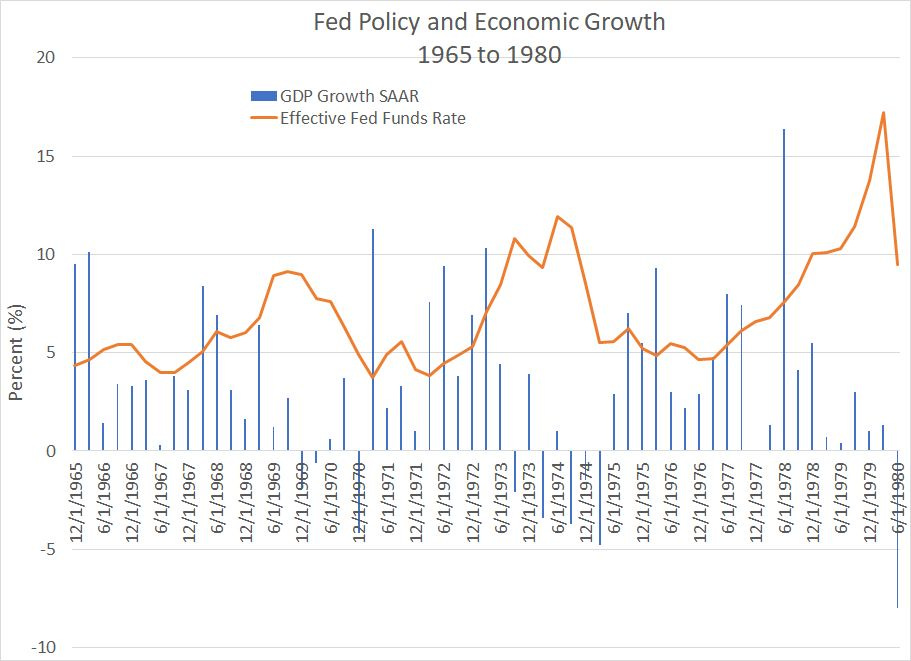
Source: Bloomberg
This chart shows quarterly real US economic growth as a blue column as well as the effective nominal Fed Funds rate at the end of each quarter from Q4 1965 to Q2 1980.
You can see the boom-bust nature of the cycles back in the 1970s – a bust in 1970 (recession) gave way to a boom in 1971-72 and an even bigger bust in 1973-75, one of the worst recessions in the US since the 1930s. There was yet another economic boom in the Q2 1975 to 1978 period followed by the double-dip recession of the early 1980s.
You can clearly see how Fed policy helped feed and amplify the volatility of the cycle in the 1970s. For example, the Fed was late in hiking rates amid the boom of 1971-72 and was then forced to slam on the proverbial brakes in 1973 in response to soaring inflation and the oil crisis. The result was that nasty bust in 1973-75.
Eventually, in response to the 73-75 recession, the Fed pushed the accelerator to the floormat into 1977, resulting in a new economic boom (even in real terms shown on this chart) accompanied by resurgent inflation.
I think there’s a lesson in the true nature of “stagflation” that’s entirely relevant to the current market environment.
Take a look:

Source: Bloomberg, Federal Reserve Bank of Atlanta
This chart shows the Federal Reserve Bank of Atlanta’s GDPNow Estimate.
This is a real-time model of the health of the economy that’s updated based on incoming data throughout the quarter. The model incorporates a wide range of releases including the ISM Manufacturing and Non-Manufacturing Indexes, the monthly Employment Report, inflation data and retail trade.
Currently, this model is showing third quarter 2023 US real GDP growth at a seasonally adjusted annualized pace of 4.94%. That’s a blistering pace of growth when you consider that in the first half of 2023, US economic growth hovered around 2%.
Right now, the consensus on Wall Street for Q3 is for growth around 2%; however, the GDPNow estimates are widely watched, and many believe they’re an indication Q3 growth could come in hotter than expected when the official data is released toward the end October.
This combination of high economic growth and high inflation isn’t consistent with the popular myth of “stagflation,” a period of weak growth and high inflation.
However, it’s entirely consistent with the reality and experience of the 1970s stagflation period when economic growth went through several boom-and-bust cycles amid a broader backdrop of high inflation and wide swings in the conduct of monetary policy.
The 1970s boom-bust, stop-go cycle of economic growth, inflation and extremes in monetary and fiscal policy is a working approximation of the current market environment.
DISCLAIMER: This article is not investment advice and represents the opinions of its author, Elliott Gue. The Free Market Speculator is NOT a securities broker/dealer or an investment advisor. You are responsible for your own investment decisions. All information contained in our newsletters and posts should be independently verified with the companies mentioned, and readers should always conduct their own research and due diligence and consider obtaining professional advice before making any investment decision.