

The Vicious Cycle
The Vicious Cycle
The big risks of big government...

Let me start this issue by saying I’m not bearish on stocks in the near-term.
As I’ll explain in the “Actions to Take” section below, September has a well-deserved reputation as a poor month for stock market returns. However, August corrections for both the S&P 500 and Nasdaq 100 held key support levels and, this week, we’ve seen some rallies on strong breadth that typically signal additional near-term upside.
Over the intermediate-to-long-term, I’m growing increasingly worried about the outlook and that’s the focus of the bulk of this issue.
Every major market cycle and US recession features some sort of crisis; the housing and credit crisis of 2007-09, the inflationary oil shocks of the early 1970s or the popping of the Nasdaq Bubble in 2000-02. I believe the crisis this time around could be tied to the surge in developed market government debt, particularly in the world’s largest economy, the US.
Let me be clear.
I’m not saying the US dollar will lose its reserve currency status any time soon because there are no viable alternatives – there are no financial markets as large, open, liquid and deep as the US and Treasuries. Europe and China both face obvious economic and political headwinds that are at least as great – likely far more challenging – than those faced by the US.
I’m also not saying the Treasury will default or will be unable to fund its debt. After all, the US government borrows in dollars, a currency it can also essentially create at will (more on this in a moment).
Rather the problem, in my view, is the US federal government is becoming so large – such an important and assertive actor in the economy – that it’s already starting to crowd out private investment and consumption in deleterious ways.
Let’s start with this:
Government Spending and Debt
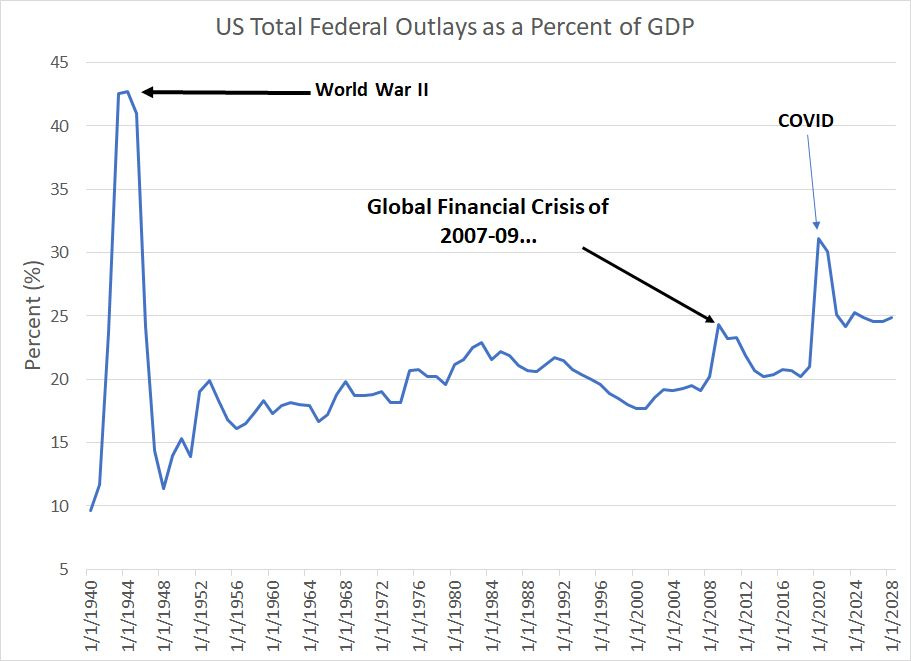
In 2009, total US federal spending reached almost one-quarter of gross domestic product (GDP), the highest level since World War II, as the government sought to stimulate economic growth coming out of the severe 2007-09 Great Recession.
In 2020, spending soared even higher, to more than 31% of GDP, amid a slew of initiatives aimed at alleviating the economy-killing effects of unprecedented economic lockdowns imposed in an effort to contain the spread of coronavirus.
And here’s what’s even more worrying than the actual level of spending in 2020:
Source: Bloomberg
Just look at the pattern of federal spending from year to year. Following the 2007-09 Great Recession, spending surged, but then fell back to around 20% of GDP from 2013 through 2019. That’s the typical trend – the government seeks to spend countercyclically to stimulate growth when the economy is weak, and then reduces spending once economic growth recovers.
However, the COVID cycle is clearly different. Spending spiked to 31% of GDP in 2020, and the US economy endured a record-brief recession from February to April of that year. However, even though the recession was clearly over by the autumn of 2020, the US government continued to spend at unprecedented peacetime levels over 30% of GDP in 2021. In fiscal year 2022, spending fell back to 25.1% of GDP, well off its 2020-21 peak, but still above the height of fiscal stimulus amid the long and severe recession of 2007-09.
And, based on estimates from the White House Office of Management and Budget (OMB), US federal outlays are expected to remain at this high plateau of about 25% of GDP through at least fiscal year 2028.
As you might expect, the government has been running large deficits to fund this spending spree, resulting in a surge in US public debt outstanding:

Source: Bloomberg, OMB
As you can see, total US government debt held by the public totaled just 35.2% of GDP in 2007, the year before the Great Recession and financial crisis and was just under 80% of GDP in 2019 just before COVID lockdowns.
By fiscal year 2024, the OMB estimates US debt will exceed 102% of GDP, and by 2028 it will top 107%, above the all-time World War II era peak of 106.2% of GDP set in fiscal year 1946.
As I wrote in the last issue, the Treasury plans to sell more than $1 trillion in new debt in the current quarter alone to fund this elevated level of spending and early estimates point to an additional $800 to $900 billion in new debt for Q4 2023.
And that brings me to a point I’ve covered on numerous occasions since the spring:
The National Balance Sheet
When the Treasury auctions new debt, there must be a buyer – there’s always someone on the other side of the trade.
The buyer could be an individual, a corporation, a bank, the Federal Reserve itself or a foreign central bank. And the Fed’s balance sheet, released each Thursday at 4:30 PM Eastern Time, gives us an important and timely look at who is buying the US Treasury’s debt.
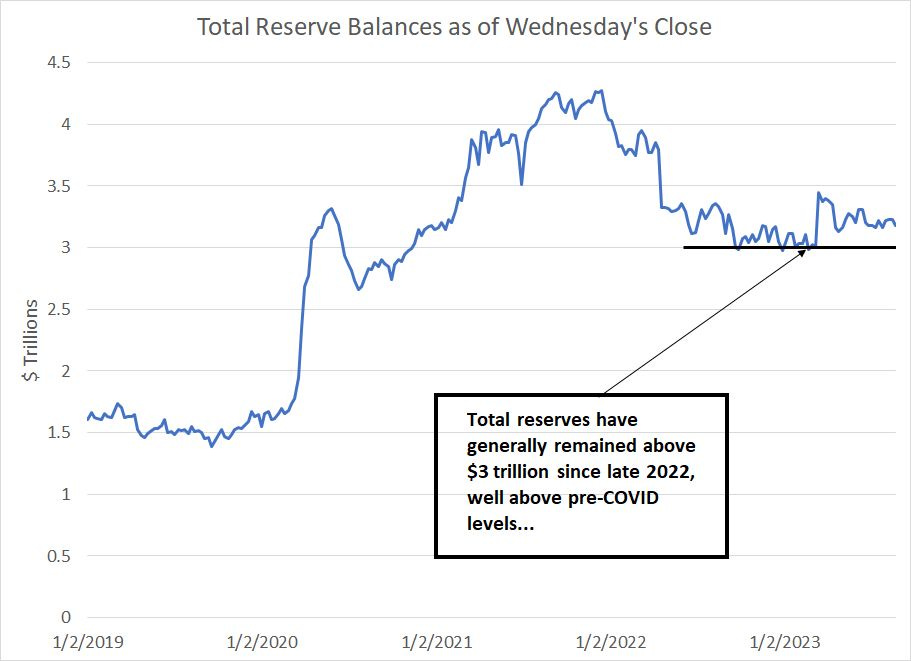
The key trend to watch is bank reserves:
Source: Bloomberg, Federal Reserve
When the Federal Reserve undertakes Quantitative Easing (QE), it’s buying Treasury and mortgage-backed securities to hold as assets on the central bank’s balance sheet. When the Fed buys a Treasury bond, it pays for those securities using newly created money; this has the effect of both taking the bond off the market (reducing the supply of Treasury bonds) and creating a new cash deposit in the financial system.
One way this shows up is via an increase in reserves US commercial banks hold at the central bank, which is what’s depicted in my chart above.
As you can see, when the Fed started a new round of quantitative easing in early 2020, total US bank reserves sky-rocketed from about $1.65 trillion at the end of 2019 to a peak of over $4.25 trillion in late 2021.
This represents stimulus for the economy because bank reserves underpin credit creation across the financial system – simply put, higher reserves means more lending to consumers and businesses while the Fed’s buying drives yields lower (pushes bond prices higher), reducing the cost of borrowing money.
Quantitative tightening (QT), a process by which the Fed seeks to reduce its holdings of Treasury bonds and MBS, is designed to have the opposite impact, a fall in bank reserves that serves to tighten up credit conditions and slow economic activity. Slowing economic growth and tightening in credit conditions is a feature, NOT a bug of QT – the idea is that slowing aggregate demand across the economy will help bring down inflation.
The problem with QT (and QE) is the impact of these policies is somewhat unpredictable and non-linear. We know from historical experience that if bank reserves fall too far, there’s risk of a destabilizing credit crunch that causes US economic activity to slow suddenly and quickly; however, no one can know with any degree of certainty what the appropriate, or economy-neutral level, of reserves might be.
And here’s what’s crucial: Treasury debt sales and the level of bank reserves are intimately related.
When the Fed is buying bonds under QE, they’re absorbing some of the supply of new bonds the Treasury issues to fund spending each month. These are bonds which would otherwise need to be absorbed by the private sector; individuals, banks, foreign central banks, or corporations would need to buy this debt.
QE not only adds to bank reserves and reduces credit costs for consumers and businesses, it also makes it easier for the government to fund spending and reduces the Treasury’s debt service costs.
The current situation represents a sort of vicious cycle of big government for the US economy and bank reserves:
1. The Fed is no longer buying bonds and, therefore, the central bank is no longer helping to absorb the Treasury’s issuance of new debt while keeping interest rates low.
2. The Treasury is spending at an historically elevated level, leading to a sizable increase in new debt issuance, a rising tide of new debt that must now be absorbed entirely by private sector buyers.
3. Because of rising short-term interest rates and the rising supply of new Treasury bonds, notes and bills, yields are rising across the curve, raising the government’s debt service costs, resulting in the need to further increase auctions of new debt just to fund interest on current debt outstanding.
It's tough to see on my chart of bank reserves above, but just last week the total level of bank reserves tumbled by $52 billion to $3.177 trillion. It’s impossible to know with any degree of certainty, but it’s likely that partly reflects money withdrawn from US commercial banks and used to purchase Treasury bonds; for example, the US Treasury sold $24 billion in 2-year notes on Wednesday the 23rd and $16 billion in 20-year bonds.
The good news: It's unlikely $3.177 trillion is a critical level for bank reserves. After all, after falling precipitously in the early months of QT, bank reserves hit a low of a little under $3 trillion in late 2022 and have remained above that level ever since.
However, as Treasury continues stepped-up issuance in coming weeks and the Fed proceeds with QT, I’m looking for bank reserves to eventually break down to new cycle lows below $3 trillion. Again, it’s impossible to know exactly when QT will “bite” or the exact level of reserves when credit conditions will tighten more dramatically. But risks are rising we’ll find out the hard way in the coming months and the shift could be sudden.
Moreover, the truth is that while Fed QT has yet to show up in the form of a major economic slowdown, it’s tough to argue all is well with the nation’s financial system:
Source: Bloomberg, Federal Reserve
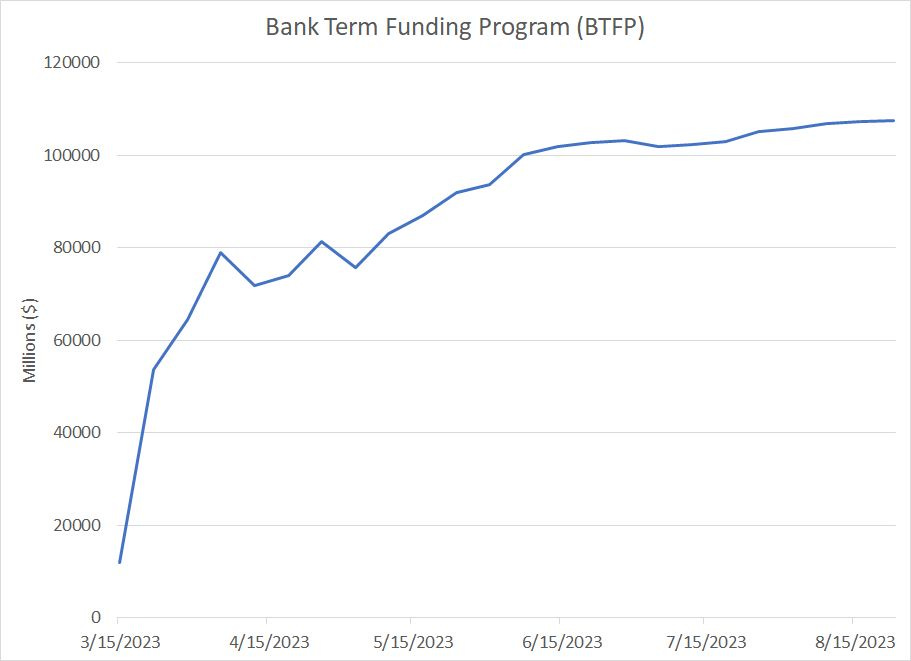
The Bank Term Funding Program (BTFP) is the emergency program set up by the Federal Reserve in response to the regional bank collapse back in March. The idea is pretty simple, banks can borrow money from the Fed using Treasury bonds they hold as collateral; Treasuries pledged as collateral are valued at their full face value rather than the (lower) fair market value.
As you can see here, the BTFP grew rapidly immediately after it was created in mid-March to $100 billion in loans outstanding by early June. Since then, growth has been more measured; however, BTFP reached a record high of over $107 billion just last week, a signal that the regional banking system still requires significant support despite the appearance of calmer markets.
Indeed, one only need glance at the charts of the regional bank stocks to see all is far from healthy right now:
Source: Bloomberg
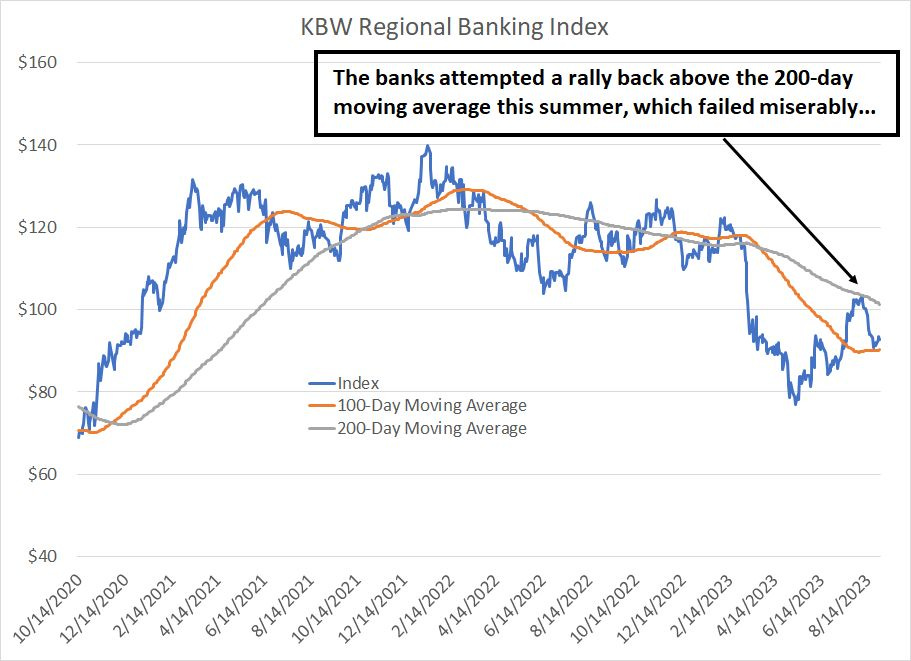
As you can see here, the KBW Regional Bank Index broke sharply lower amid the banking crisis in March, finding a low in May. The banks did attempt a rally this summer, which failed right into the 200-day simple moving average (grey line), one of my favorite longer term trend indicators.
The regionals are now trading roughly where they were in late 2020, almost 3 years ago; over an equivalent period, the S&P 500 is up more than 25%. I’d posit that’s not the pattern you’d expect in healthy financial markets.
And that brings me to this:
Debt Service, Tailing Auctions and Taxation
When the Fed raises the Fed Funds rate it tends to push up yields on Treasury bonds across the curve.
And, of course, as I just explained, when the Fed undertakes quantitative tightening (QT), reducing its holdings of Treasuries, that forces the private sector – individuals, corporations, and banks – to absorb more of its issuance.
The increase in Treasury supply sold to the private sector also tends to drive up yields. Put in a different way, the Treasury has to offer a higher rate of interest to tempt investors to buy its debt.
So, the conduct of monetary policy also has a direct impact on this:
Source: Bloomberg, US Treasury, Congressional Budget Office
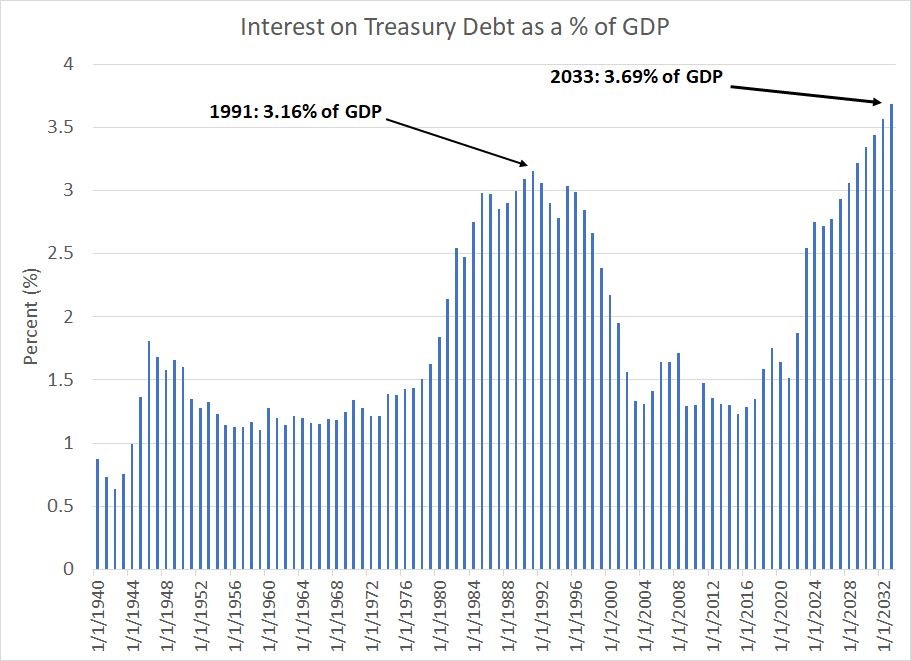
This chart shows total net interest paid on the US national debt as a percentage of Gross Domestic Product (GDP) since 1940. I’ve also included the CBO’s latest projections for national debt service costs through 2033.
As you can see, in 2022 net interest paid by the Treasury reached about 1.87% of GDP, the highest since 2001 and in 2023 CBO projects net interest paid to jump to more than 2.5% of GDP, the highest since 1998.
Finally, by 2033, CBO projects net interest paid on the rising US national debt burden to rise to almost 3.7% of GDP, a record high based on data since 1940.
And if 3.7% of GDP doesn’t sound like a lot, let’s put it into a bit of perspective. In 2022, based on CBO estimates, net interest paid on the national debt represented 7.67% of total federal outlays (spending) and about 28.7% of the total level of discretionary spending.
By 2033 net interest costs are projected to soar to 14.7% of total outlays and 60.9% of the level of discretionary spending (spending beyond entitlement programs like Medicare and Social Security).
And even that looks conservative – you see, the CBO estimates the average interest rate paid on debt held by the public will rise from 2.7% in 2023 to just 3.2% in 2033. If prevailing interest rates were to rise more meaningfully in coming years because inflation has reached a higher plateau, then the cost of servicing the national debt would likely be significantly higher.
Government bond auctions in recent weeks have encountered mixed results.
In the last issue, I wrote about how the August auction of 30-year Treasuries “tailed;” yields spiked higher immediately following the auction, meaning Treasury had to pay a higher yield to sell the debt. This week’s auctions of 2-year and 7-Year Treasuries fared far better, showing strong demand, though that was due in part to the fact yield on these issues is higher than it’s been in many years.
This will be a key pattern I’ll be watching in coming months – as the Treasury steps up the size of its auctions to fund the yawning deficit, it’s important to monitor demand for government debt and assess whether the government is forced to sell bonds at higher yields to attract adequate demand.
And, as I outlined earlier, it will be equally important to keep tabs on who is buying Treasury debt – more specifically, the degree to which Treasury debt sales result in further declines in US bank reserves in the Fed’s weekly statements.
Lastly, let’s turn to taxes:

Source: Bloomberg, US Treasury
This chart represents a chart of annual Treasury income tax receipts as a percentage of GDP since 1934.
Some will argue that the US Treasury could simply raise taxes – boost revenue – to help fund some of its stepped-up spending plans and reduce growth in the national debt.
However, this chart illustrates why that’s not a viable path either. Note that historically when income tax receipts have spiked to the 9% to 10% range, the US economy has been in, or soon enters, recession.
In 2022, US income tax receipts reached a record high of 10.5% of GDP, and projections from Treasury show taxes hovering at elevated levels at least through fiscal year 2028. Longer term CBO projections show individual income tax receipts at 9.5% of GDP through to at least 2033; despite that historically elevated tax burden, CBO expects the national debt to rise to record highs as a percentage of GDP and for the US primary budget deficit to remain at near 3% of GDP by 2033.
All this leaves the US government and Federal Reserve trapped in a difficult vicious cycle.
Jerome Powell has indicated that, for now at least, he’s focused on bringing inflation back down to the Fed’s 2% target and he’s not factoring Treasury’s debt service costs into decisions regarding the conduct of monetary policy. However, you can see the problem with that – the longer the Fed keeps interest rates elevated, the higher Treasury’s debt service costs and the more debt it needs to sell to fund rising interest costs.
Of course, this does have negative feedback on the economy over time as larger Treasury auctions, funded by the private sector, result in declining bank reserves and the diversion of capital away from private investment or consumption to the government. That’s called crowding out – the government’s borrowing needs “suck” so much money out of the economy, it impacts private consumption, investment, and economic growth.
The alternative would be for the Fed to begin cutting rates as inflation nears its target or even restarting QE in the next economic downturn. That, of course, would ease Treasury’s debt service costs, but it would also risk resurgent inflation.
And take a look:
Source: Bloomberg
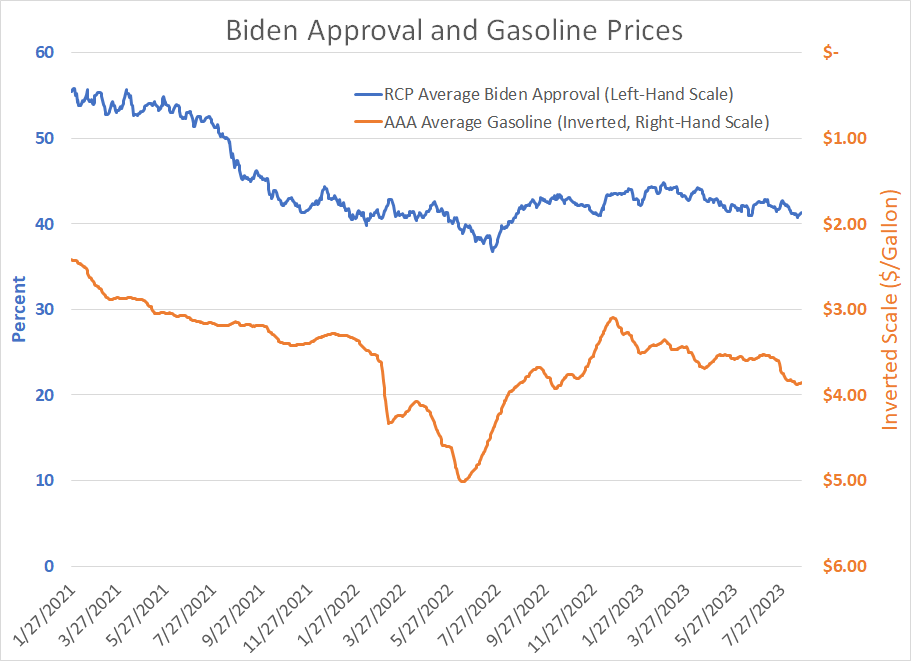
Inflation is deeply unpopular with the electorate.
This chart shows the average Real Clear Politics (RCP) approval rating for President Biden in blue and the AAA average US retail gasoline price in orange; I plotted the latter on an inverted scale so that a falling orange line suggests rising gasoline prices.
It’s not tough to see the correlation – rising gasoline prices tend to result in a decline in approval ratings for the sitting President. It is always thus.
In my view there’s a real and growing risk this vicious cycle leads to a volatile economic environment more like the 1970’s “stagflation” period. In such a scenario, the opposing conduct of monetary and fiscal policy would result in unpleasant tradeoffs between Treasury debt service, inflation, prevailing interest rates and economic growth.
As I said at the beginning of this issue, every economic cycle and every recession in history includes a “crisis.” It’s not always easy to identify the nature of that crisis before the fact; however, it’s useful to look for something unusual that breaks the historic pattern.
The melt-up in the Nasdaq in 1999-2000 certainly qualifies and gave a preview of the 2000-02 “tech wreck” years. Much the same can be said for the parabolic increase in home prices and easing credit conditions in the 2004-06 era, which led to the residential housing collapse and credit bust in 2007-09.
In this case, it’s tough to look at the charts I’ve just presented without concluding there’s something very unusual – even unprecedented -- underway in the conduct of US fiscal policy, the permanent high plateau of deficit spending, and the speed of the rise in US public sector debt. It’s hard to imagine a scenario where this does NOT result in some sort of dislocation in US equity and debt markets.
And when you consider, for better or worse, the central importance of US Treasuries as a risk-free asset in the global economy and the concurrent rise in government spending and debt across the developed world, the potential fallout is significant.
With these points in mind, here’s my shorter term take on the stock market and economy and 3 key themes I’m watching for the model portfolio in September:
Keep reading with a 7-day free trial
Subscribe to The Free Market Speculator to keep reading this post and get 7 days of free access to the full post archives.