

This Time Isn't Different
This Time Isn't Different
Recession Probabilities Continue to Grow

The Good Friday employment report included few meaningful surprises.
The official consensus was for the US to add 230,000 payrolls in the month of March and the actual number came in at 236,000; when you consider the US labor force is currently just under 160.9 million people, 6,000 payrolls isn’t even a rounding error.
The whisper number for nonfarm payrolls – an unofficial consensus on Wall Street – was closer to 215,000 jobs, due to some weakness we saw in leading economic data series like the Institute for Supply Management’s PMI Manufacturing and Services data earlier in the week. So, I suppose you could say last week’s employment report wasn’t as weak as some had feared.
When US markets reopened on Monday, the reaction was consistent with a strong number and the view this means the Fed will need to maintain tighter policy. Yesterday afternoon, the Fed Funds futures market was pricing in roughly 72% probability the Fed hikes 25 basis points at its upcoming May 3, 2023 meeting compared to about a 47% chance of a 25 basis point hike as of last Wednesday’s close.
US equity markets opened broadly lower Monday with the downside led by growth and technology shares, which are widely viewed as more sensitive to interest rates, though much of that weakness reversed in the afternoon session.
There’s no doubt the monthly Employment report from the Bureau of Labor Statistics (BLS) moves markets and, in some cases, market reactions can be dramatic. That means investors can’t afford to ignore this report outright.
However, as I explained in “About that Employment Report,” I believe the market’s fascination with BLS data is overdone and the intermediate to long-term economic and market implications of this report are more dubious.
There are 3 main reasons for taking the monthly BLS number – and the financial media circus that surrounds it – with a grain of salt.
First, the monthly numbers are routinely subject to large subsequent revisions that completely change the interpretation of the data. Consider this quote from the technical notes of the actual release last Friday:
For example, the confidence interval for the monthly change in total nonfarm employment from the establishment survey is on the order of plus or minus 130,000. Suppose the estimate of nonfarm employment increases by 50,000 from one month to the next. The 90-percent confidence interval on the monthly change would range from -80,000 to +180,000 (50,000 +/- 130,000). These figures do not mean that the sample results are off by these magnitudes, but rather that there is about a 90-percent chance that the true over-the-month change lies within this interval.
Source: Bureau of Labor Statistics
So, let’s take another look at last Friday’s data through this prism. The reported number was 236,000, which means the 90% confidence interval is that the US added somewhere between 106,000 and 366,000 jobs last month.
Now, if the actual reported number had been on the order of 106,000 to 175,000 payrolls – well within that confidence interval – the market would have likely concluded the risk of recession was rising, and that the economy dramatically slowed in March. In other words, the stock and bond markets would have likely reacted in the exact opposite way we saw on Monday morning.
In contrast, what do you think would have been the result of a +300,000 to +350,000 payrolls release?
I’d expect we’d been looking at a far more dramatic response in equity and fixed income this week, including a significant sell-off in growth stocks and the Nasdaq, more upside for cyclical commodities and value stocks and a larger sell-off in bonds.
And the truth is that all these outcomes are all well within the realm of probability – subsequent revisions within the 90% confidence interval could show the US labor market in March weakened notably, remained steady or strengthened significantly.
Further, I’d note the monthly employment report is based on two surveys – the establishment survey of 122,000 businesses and government agencies, and the household survey of 60,000 eligible households. Both surveys are typically conducted in the week or pay period that includes the 12th of the month.
Thus, any changes in the labor market that occurred after the middle of March may not even be reflected in the March jobs number. Normally, that might not be much of an issue; however, in this case, March 12th was the Sunday after the collapse of SVB Financial and the start of a volatile two weeks for US regional banks and credit conditions.
Could it be that businesses laid off workers in response to that turmoil?
It’s certainly possible in my view and we won’t know until May 5th when the government releases the April numbers.
Second, employment is a coincident-to-lagging economic indicator. That means employment generally weakens just as the economy enters recession or after the US economy is already in recession. One reason is what’s known as labor hoarding – essentially, companies are reluctant to let workers go until it’s clear there’s a looming recession and they’re desperate to cut costs.
Simply put, once payrolls start falling outright, the stock market is likely well off its highs and the economy already in recession. Labor is usually among the last markets to weaken late in the expansion cycle or early in the recession.
Third, as I’ve explained in recent updates, coronavirus-era restrictions and lockdowns have wreaked havoc on the employment numbers. Seasonal adjustments applied to headline data by BLS are based on historical patterns; when patterns change it can take a few years for that to be reflected in these adjustments.
Patterns in employment were skewed by the impact of lockdowns and reopening in 2020-21 as well as trends such as a rapid shift in favor of online shopping. This is a problem not just for employment data but for other series, like retail sales, that apply seasonal adjustments.
And two more points about last week’s labor market data.
Some Troubling Signs
The headline employment number is the most widely reported series in the monthly BLS Employment Situation report and, as I just outlined, it was a bit stronger than some feared.
However, take a look at this:
Source: Bloomberg
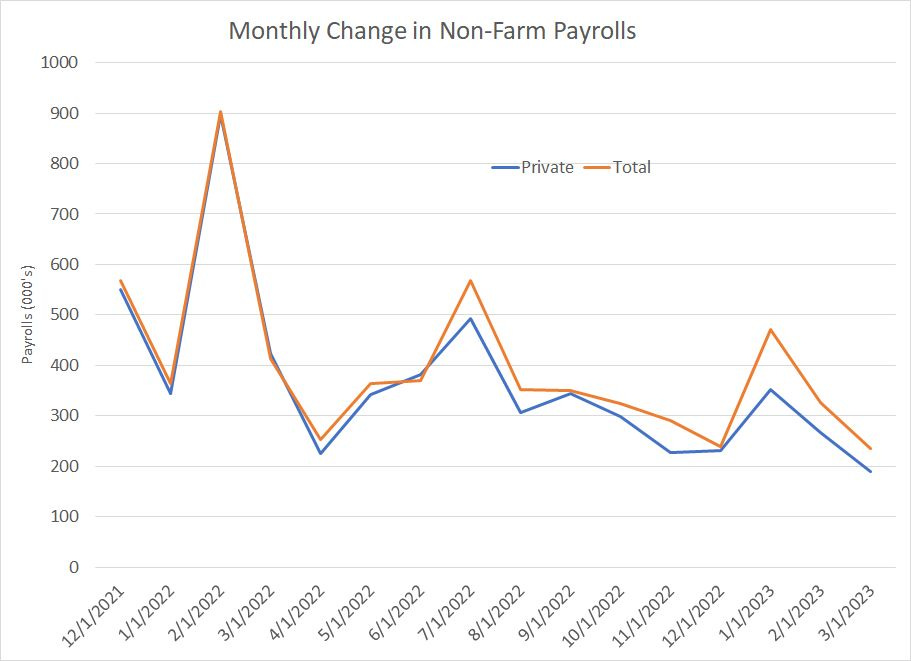
This chart shows the monthly change in total US payrolls in orange and private (non-government) payrolls in blue.
What’s interesting is that while total US payrolls increased by a bit more than the market expected, private payrolls increased by +189,000 against expectations for a +218,000 gain. This was also the smallest monthly rise in private non-farm payrolls since December 2020; you can see the steady trend lower that started in early 2022.
Again, that’s not a huge miss and it’s well within the 90% confidence interval for this series; however, the bottom line is that without a larger-than-expected increase in government payrolls, the headline payrolls number would have missed.
It’s unclear if some of this may be due to reclassification of employees at failed banks like SVB Financial and Signature Bank as government employees following FDIC seizure; however, the, combined total employment at these banks is too small to account for all the weakness.
Since labor market trends in private businesses, rather than government, are more likely to reflect prevailing economic conditions this is an additional reason to question the prevailing media and Wall Street spin about a still-robust US labor market right now.
I’m also watching this:
Source: Bloomberg
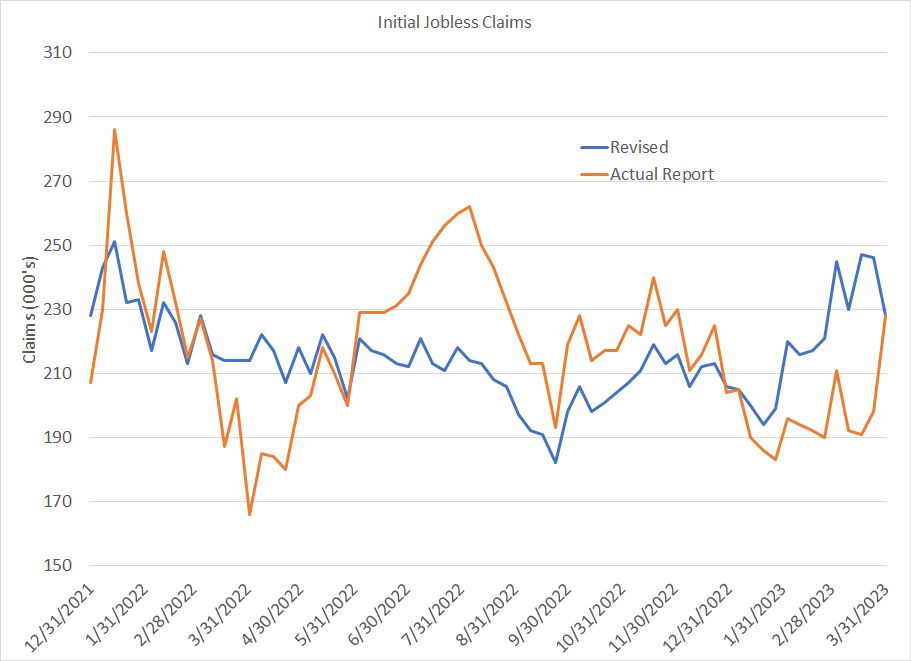
This chart shows the total number of people filing to claim initial unemployment benefits – this only counts the first filing for unemployment, not subsequent (continuing) claims. When this number spikes, it reflects employers laying off workers, which ultimately filters through into broader employment and payrolls trends.
Spikes in the data are typical before recessions and this data offers a more real-time estimate of US economic conditions because it’s released weekly rather than monthly.
In March, the government revised data for the weekly initial claims numbers significantly – the blue line on my chart shows the most recent revision while the orange line is the actual weekly release before any revisions.
Two points to note.
First, the revisions are significant and can change the picture of labor market conditions. For example, there appeared to be a big spike in claims from March through July 2022 which suggested spreading economic weakness. However, the government has now revised away that spike – claims remained steady through most of last summer and then fell into late September 2022, indicative of a still-robust or strengthening labor market.
The claims numbers are seasonally adjusted, so this is likely just more evidence of distortions to economic data caused by 2020-21 economic lockdowns.
Second, the latest estimates do show a significant rise in claims that started at the end of January this year. The absolute number of claims is still a bit too low to signal imminent recession; however, it’s notable that in recent weeks claims have jumped to the highest levels in more than a year.
And that brings me to this:
Recession Probability is Growing
While the headline payrolls number was in-line to slightly better-than-expected, and I’m still hearing talk of a soft landing or no landing scenario for the US economy, I continue to see growing evidence of spreading weakness in US economic data.
And, what’s even more worrying is that much of that weakness is reflected in economic series that tend to lead the cycle, rather than in coincident-to-lagging indicators like payrolls.

Source: Bloomberg
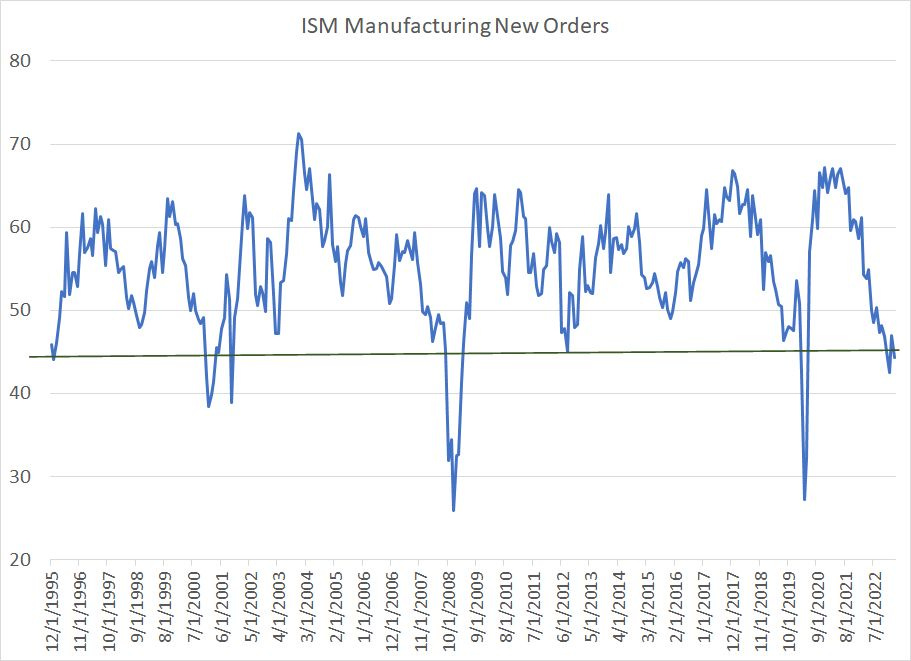
This chart shows the ISM Manufacturing PMI Index since the end of 1995; I’ve marked US recessions over this time with red arrows.
ISM is a diffusion index based on a survey of manufacturing companies; levels above 50 indicate expansion of the manufacturing sectors of the US economy while levels below 50 signal the opposite.
In practice, you’ll notice ISM Manufacturing has often dropped below 50 without the US economy entering recession – these “soft patches” and mid-cycle slowdowns are a common part of most economic expansions. Sometimes, these slowdowns will catalyze market corrections within bull markets which routinely offer good buying opportunities for investors.
You do NOT want to sell stocks after a mid-cycle slowdown, only recessions tend to result in prolonged equity weakness and broader market corrections well over 20%.
When ISM slips below a level of about 45, the implications are more sinister and indicate a high probability recession is already underway or imminent. Right now, we’re perched right on that recessionary threshold – the latest reading for ISM released last week was 46.2.
That’s a new cycle low for ISM, the lowest reading since May 2020 and well below economist expectations for a reading of 47.5.
One more component of this report to watch:
Source: Bloomberg
This chart shows the ISM Manufacturing New Orders index, which is part of the monthly ISM release. It measures the incoming pace of orders for manufactured goods where readings above 50 signal a rising pace of new orders.
This is considered a leading component within ISM – after all, when a manufacturer sees a rise in new orders, they’re likely to boost production, and possibly employment, to meet rising demand. This tends to result in a rise in the headline PMI number in future months.
Look at these two indices in tandem to help differentiate economic soft patches, often a great signal to BUY stocks, from a warning of recession ahead.
Simply put, readings in the headline ISM below 50 that are accompanied by a decline in the New Orders component below 45 (horizontal green line on my chart) historically suggest elevated probability of imminent downturn. There are exceptions – for example, this indicator triggered in 1995 and there was no recession – however applying a New Orders filter to the headline ISM data helped filter out several of the temporary economic soft patches in 1998, 2003, 2011-12 and 2015-16.
With ISM Manufacturing just over 46 and the New Orders component at 44.3 and below 45 in two of the past 3 months, a US recession within the next 3 to 6 months looks the high-probability call.
We’re at a stage of the cycle where the data is near a tipping point – I’d expect either a rapid recovery to levels that indicate the economic weakness is fleeting, such as we saw in 1996, or serious deterioration that makes the soft-landing view widely unpalatable, within just a month or two.
I continue to see the latter as more likely and, if historical relationships hold, clear evidence of the slide into recession is likely to coincide with an acceleration to the downside for the broader stock market.
The Order of Things
If my recession call is correct, the US market has further to fall, and the October 2022 lows are unlikely to hold.
Take a look:
Source: Bloomberg, NBER
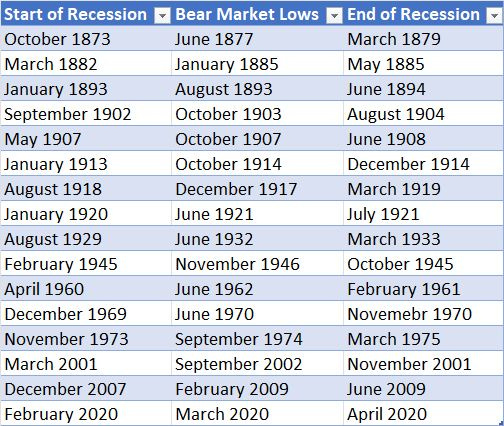
This chart shows every notable recessionary bear market in the S&P 500 since the 1870s, including the date the NBER-defined recession started, the month the market bottomed and the month the recession ended.
As you can see, the typical pattern is the market peaks before a recession, sells off and bottoms before the recession ends.
Out of the 16 listed market and economic cycles, there is only one occasion where the stock market formed a major low before the economy even entered recession – that’s the December 1917 bear market low associated with the 1918-1919 recession.
However, this cycle was unique because of World War I, which started in the summer of 1914 and ended with an armistice on November 11, 1918. The United States officially entered the war on April 6, 1917, so the economic cycle was driven by military spending in 1917-18 followed by a hangover as spending declined in late 1918 and through 1919.
I’m a big believer in the old market saw that holds the most expensive words in financial markets are “This time it’s different.” Unless this cycle is different than 15 of the last 16 market and economic cycles over the past 150 years, the October 2022 lows for the S&P 500 around 3,500 won’t hold when the US enters recession later this year.
DISCLAIMER: This article is not investment advice and represents the opinions of its author, Elliott Gue. The Free Market Speculator is NOT a securities broker/dealer or an investment advisor. You are responsible for your own investment decisions. All information contained in our newsletters and posts should be independently verified with the companies mentioned, and readers should always conduct their own research and due diligence and consider obtaining professional advice before making any investment decision.