

To Recession or Not to Recession?
To Recession or Not to Recession?
The consensus is firmly in the soft landing camp...

Soft landings are (almost) a mythical beast.
Since 1970 there have been, arguably, just two soft landings for the US economy -- the first in the mid-1980s and the second in 1995, almost 30 years ago.
I say “arguably” because there’s no official definition of what constitutes a soft landing, or for that matter what exactly is meant by the term recession. So, I should probably back up at this point and outline how I define these terms.
First, you may have heard recession defined as two quarters of consecutive negative change in US real Gross Domestic Product (GDP); some call this a “technical” recession. However, whatever you care to call it, I find this definition next-to-useless at least when it comes to making investment decisions.
While GDP is important, it can be skewed by factors such as trade (exports less imports), changes in private inventories or government programs and fiscal stimulus measures.
Further, from a practical perspective on this basis there was no US recession in 2001:
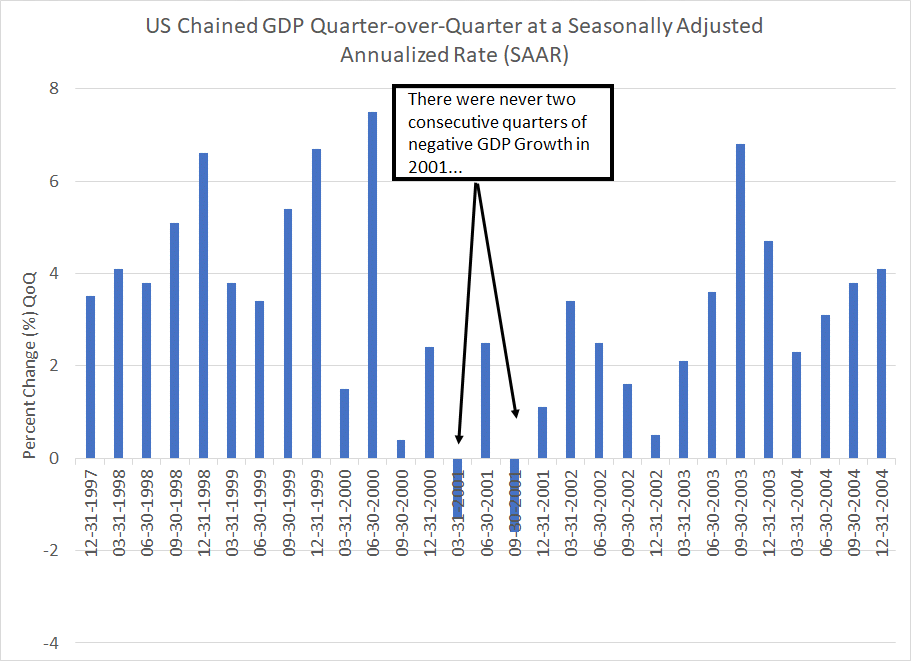
Source: Bloomberg, Bureau of Economic Analysis (BEA)
As you can see, GDP went negative in Q1 and Q3 of 2001, but Q2 2001 saw the US economy grow by around 2.5%, so there was no “technical” recession.
However, it probably felt like a recession to the millions of Americans who lost their jobs in 2001-02 – the unemployment rate rose from a multi-decade low around 3.8% to a peak of 6.3% in June 2003.
And someone apparently forgot to tell the stock market the economy skirted recession – the S&P 500 fell 46.3% from its March 2000 peak to its October 2002 trough, the Russell 2000 was down 43.1% and the Nasdaq 100 plummeted 82.8%.
GDP is also a lagging indicator – it tends to register recession only long after a downturn is underway. For example, look at the quarter-over-quarter change in US real GDP back in 2006-2010:
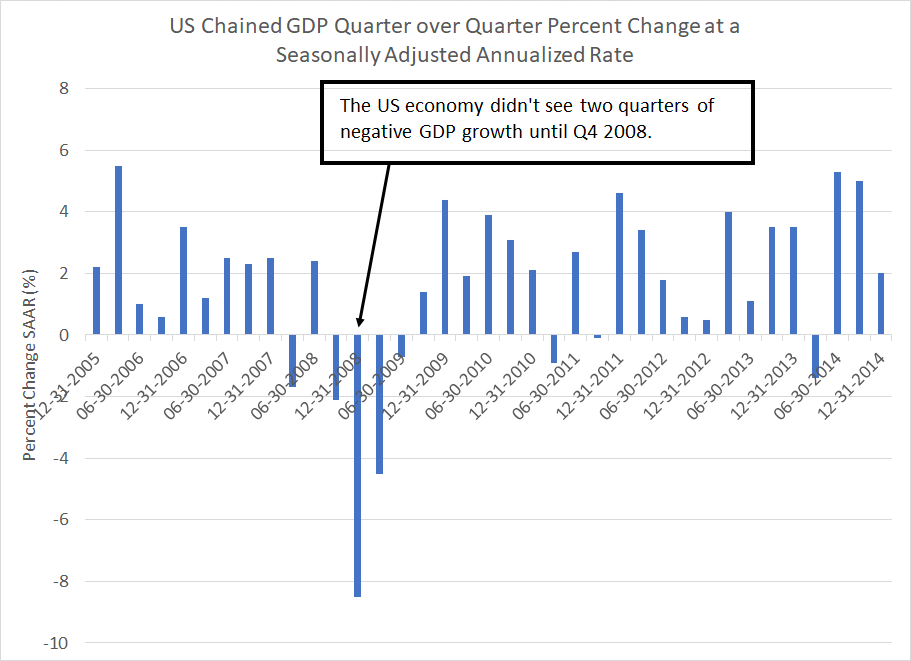
Source: Bloomberg, BEA
As you can see, the US economy didn’t log two consecutive quarters of negative GDP growth until Q4 2008.
However, by the end of 2008, the US unemployment rate was already at a 16-year high of 7.3%, up from a cycle low of 4.4% in late 2006. And the S&P 500 was already down more than 40% from its peak in October 2007.
Of course, you might argue there were plenty of troublesome economic and credit market trends in late 2007 and the first half of 2008 that made it obvious the US was headed for recession. Surely no one would wait until the actual GDP data is released to declare a recession in progress, right?
That view reflects the benefit of hindsight.
There were plenty of calls for a soft landing, or a mild and short-lived recession, in late 2007 and early 2008.
For example, in late September 2007, staff economists at the Dallas Federal Reserve noted:
A soft landing with a slow convergence to trend growth is probable, unless uncertainties among households and investors suddenly trigger a sharp consumption slowdown or the credit crunch spreads beyond the housing sector.
--"US Economy on Track for a Soft Landing” Reuters September 26, 2006
In testimony before Congress in April 2008, then Fed Chair Ben Bernanke held out hope for the US economy to achieve a soft landing or mild recession. He also predicted the US economy would grow in the second half of the year and into 2009 aided by the government’s $168 billion stimulus package and the Fed’s aggressive interest rate cuts.
Indeed, fiscal stimulus clearly did influence the GDP data for Q2 2008 as a rebound in consumer spending saw the US economy grow at a real seasonally adjusted annualized pace of 2.4%.
Of course, the opposite happened in the second half – the crisis deepened with the US economy contracting at a seasonally adjusted annualized pace of 8.5% in Q4 2008.
As I’ve written before, trying to assess the health of the US economy using quarterly GDP data, or Wall Street estimates for GDP, is a bit like driving down the highway at 100 miles per hour, staring intently in your rearview mirror.
Simply put, you may not see the trouble ahead until it’s too late to take action to protect your portfolio.
Instead, I prefer the definition of recession used by the National Bureau of Economic Research (NBER):
The NBER's traditional definition of a recession is that it is a significant decline in economic activity that is spread across the economy and that lasts more than a few months. The committee's view is that while each of the three criteria—depth, diffusion, and duration—needs to be met individually to some degree, extreme conditions revealed by one criterion may partially offset weaker indications from another.
Source: National Bureau of Economic Research (NBER)
NBER’s Business Cycle Dating Committee estimates the start and end dates for US economic expansions and contractions (recessions) and is widely considered the semi-official arbiter of business cycle dates. I should stress that NBER typically declares a recession underway only months after the fact, so NBER business cycle dates are not a useful real-time indicator.
However, I still find NBER dates useful for two reasons.
First, I use NBER business cycle dates when analyzing past economic cycles or looking for patterns in various sectors in different economic environments.
Second, I like NBER’s criteria for establishing a recession – in particular their requirement it’s a multi-month patch of economic weakness (duration) that’s significant in severity (depth) and impacts many different sectors of the economy (diffusion).
NBER is known to look at many different economic indicators covering everything from the labor market to industrial production and consumer spending to assess these points. So, I believe it’s useful to recreate an NBER-like analysis by looking at a variety of different leading economic indicators. These are indicators that tend to show weakness long before there’s a meaningful decline in US Gross Domestic Product.
In practice, in these updates, I’ve written about many of my favorite cycle indicators including the Conference Board’s Leading Economic Index (LEI), itself comprised of 10 different economic indicators, the Institute for Supply Management (ISM) Manufacturing Purchasing Manager’s Index (PMI) and some of the less-followed labor market indicators like trends in temporary employment.
Of course, none of these indicators are infallible, but they can provide an early warning signal of trouble ahead long before quarterly GDP.
Soft Landings and the 1995 Experience
So, that brings me to the definition of soft landing.
Simply put, a soft landing is a slowdown in the US economy that’s powerful enough to bring down inflation but does not meet NBER’s 3 D’s – it doesn’t have the duration, diffusion, or depth to qualify as a recession.
That’s a little vague, so let’s look at an actual historic cycle:
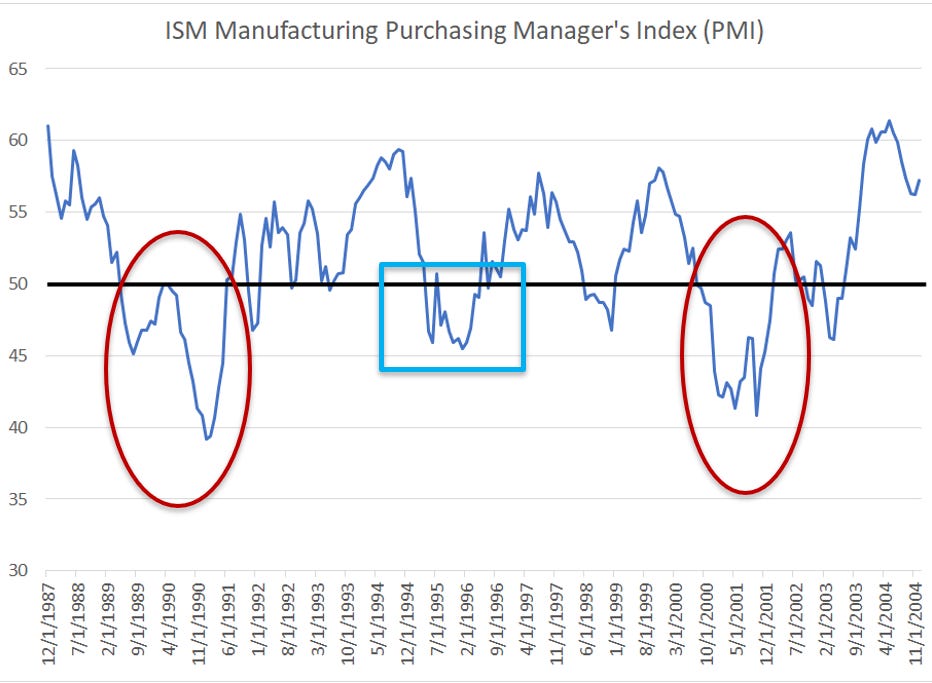
Source: Bloomberg
This chart shows the ISM Manufacturing Index for the US from the late 1980’s through the early 2000s.
ISM is a diffusion indicator where readings below 50 (thick black line on my chart) indicate contraction in the manufacturing sector of the US economy and levels over 50 indicate expansion. While manufacturing is a small portion of US economic activity relative to services industries, it’s far more cyclical and tends to turn before the economy as a whole.
That’s why I watch ISM.
In the period covered by my chart, there are two NBER-defined recessions – July 1990 to March 1991 and March 2001 through November 2001. I’ve circled both full-blown recessions in red on my chart.
In both recessions, PMI Manufacturing dipped to the low 40s and remained well under 50 for a prolonged period. Thus, a long-term decline in PMI to the low to mid 40s for a period of multiple months is a pretty good indicator a recession is underway or likely will be soon.
You will also see PMI dipped to the mid-40s in 1994-95 and remained well under 50 for several months – this was an indicator of an economic slowdown. However, the weakness just wasn’t quite severe enough, or long enough, to be defined as a full-blown recession. I’ve boxed this period in light blue.
This period is widely regarded as one of the most classic soft landings in modern US financial history:
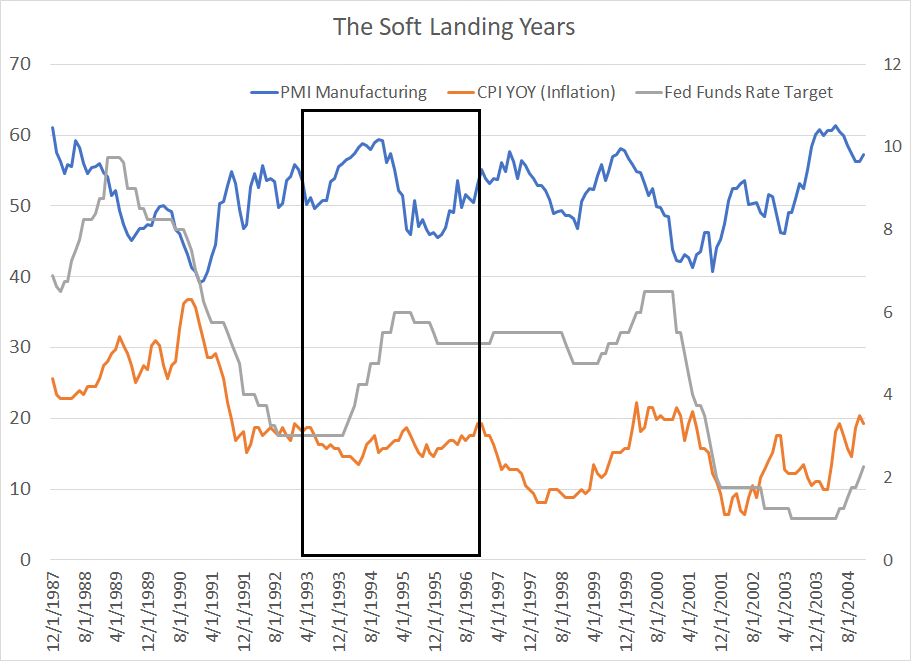
Source: Bloomberg
This chart shows the PMI Manufacturing Index (blue line, left-hand scale) from the late 1980s through the early 00’s. I’ve also added in the year-over-year change in inflation (CPI YOY) and the upper bound of the Fed Funds Target rate over the same time as an orange and grey line respectively (right-hand scale).
Look at the boxed region of my chart and you’ll see the economy started to accelerate in mid-1993 through the summer of 1994 and inflationary pressures began to build. Then Fed Chair Alan Greenspan responded by hiking rates aggressively from 4% in early 1994 to 6% by early 1995.
In response, the economy slowed, PMI slipped under 50 and inflation stabilized. The Greenspan Fed then cut rates 75 basis points from mid-1995 to early 1996. The economy stabilized and PMI recovered back above 50.
PMI remained below 50 for 10 consecutive months and reached a low of 45.5 in January 1996.
This episode is one reason Greenspan earned the nickname “The Maestro” in his years as the head of the Fed – the idea was he was adept at managing rates at a level that kept inflation under control but did not tip the economy into recession.
(Of course, Greenspan’s reputation was somewhat tarnished by the housing bubble of the early 00’s under his watch, and the subsequent bust under his successor, Ben Bernanke).
Here’s a simple rule of thumb. Historically when the PMI Manufacturing Index drops below 50 for eight or more consecutive months, the probability of recession is high. Indeed, since 1960 this indicator has only flashed twice without triggering recession – PMI dropped below 50 in February 1985 and remained there for 8 months, yet there was no recession until July 1990.
And, as I outlined earlier, PMI dipped below 50 for 10 consecutive months in the mid-1990s and there was no recession until 2001.
Per NBER, there have been 9 recessions since 1960; using this simple definition there have been just 2 soft landings. Simply put, while there’s usually talk of a soft landing ahead of economic downturns, it’s rare for the Fed and markets to actually “stick” a soft landing.
In this cycle, ISM Manufacturing PMI dipped below 50 in November 2022 and has now been below 50 for 14 consecutive months. If we do avoid recession in 2024, this would be (by far) the longest stretch of manufacturing weakness since at least the 1950s without triggering a downturn.
ISM is, of course, only one of several leading indicators I follow and have analyzed in The Free Market Speculator. However, what worries me most over the intermediate term is “soft landing” is becoming the market consensus even though many venerable leading indicators like PMI — indicators that have offered useful signals for decades — are flashing a red warning signal.
According to the latest Bank of America Global Fund Manager Survey, 72% of all investors surveyed in December 2023 expected the economy to either experience a soft landing or no discernible slowdown in growth at all this year.
Meanwhile, fund managers surveyed are the most overweight stocks relative to cash than at any time since January 2022; this is a dramatic shift in positioning from September 2022 (near the bottom for the S&P 500) when investors were the most underweight stocks relative to cash of any period since at least 2001.
So, can the US avoid recession in 2024?
Sure, anything is possible in financial markets. And certainly, the economy has proved more resilient this cycle than many, including yours truly, had expected.
However, is a soft landing the most likely outcome as market participants seem to believe?
In my view the answer is a resounding no. History suggests soft landings are rare, and the leading economic indicators I follow have never been this weak without the economy tipping into recession. Assuming this time is different as the crowd appears to be doing right now represents a dangerous level of complacency.
Let me be clear — I am not bearish on stocks right now. In fact, I’m evaluating several new recommendations for the model portfolio in the paid tier of The Free Market Speculator later this week.
As I’ve been writing in recent months, I believe the Q4 2023 rally could extend well into 2024 and the soft landing “narrative” that’s making the rounds these days certainly provides fundamental cover for such an outcome. Moreover, as I explained in last week’s issue, “Warning: Happy New Year” history suggests the weak start to 2024 for the S&P 500 may well be a normal bout of profit-taking following an extreme overbought reading at the end of last year.
This is not a good time to get too defensive on stocks.
Longer term, I continue to see a growing list of headwinds for equities as we move through 2024 and will continue to watch the incoming economic data and indicators for signs of more sinister turn in the fundamentals.
DISCLAIMER: This article is not investment advice and represents the opinions of its author, Elliott Gue. The Free Market Speculator is NOT a securities broker/dealer or an investment advisor. You are responsible for your own investment decisions. All information contained in our newsletters and posts should be independently verified with the companies mentioned, and readers should always conduct their own research and due diligence and consider obtaining professional advice before making any investment decision.