

Treasury's "Payday" Loan Problem
Treasury's "Payday" Loan Problem
Treasury's heavy reliance on T-Bills poses longer-term risks

Editor’s Note: I want to take this opportunity to wish my US-based readers a very Happy Thanksgiving.
US markets will be closed on Thursday and open only until 1 PM ET on Friday afternoon. Look for your next FMS update this weekend instead Thursday.
— EG
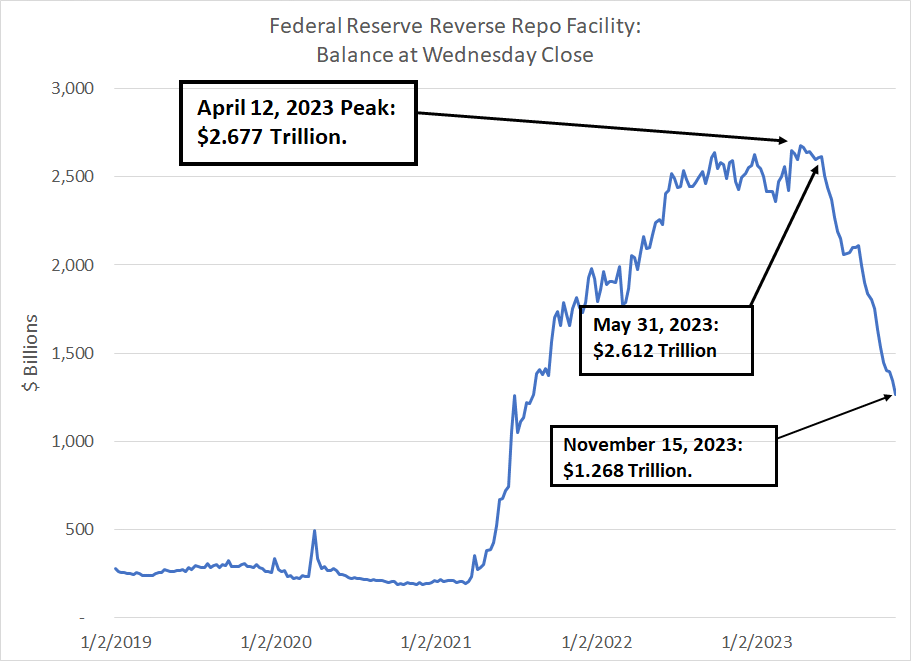
Here’s a shocking number for you: $1.41 trillion in just over six months.
That’s the decline in the size of the Fed’s Reverse Repo (RRP) facility since April 12th this year:
Source: Bloomberg
The Reverse Repurchase (RRP) facility at the Fed allows institutions to park money at the central bank on a short-term basis risk-free, generating a yield close to the Fed Funds rate. By far the largest participant in this facility over the past few years is money market funds.
So why have money market funds withdrawn more than $1.4 trillion from the RRP in just over six months?
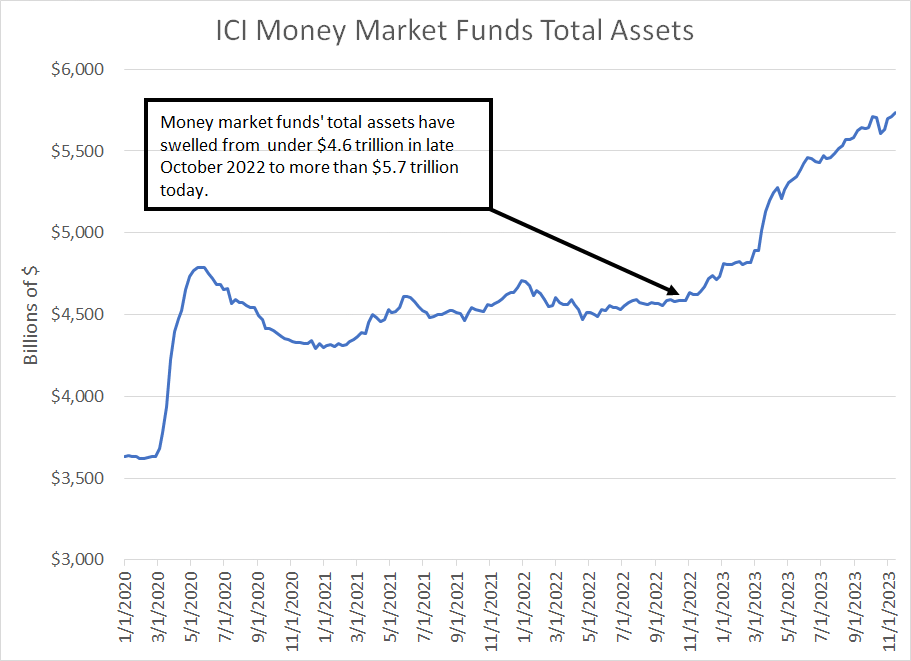
It’s not fund redemptions:
Source: Bloomberg, Investment Company Institute
The Investment Company Institute (ICI) publishes a weekly data series showing the total assets of money market funds. As you can see, ICI reports total assets held by these funds is over $5.7 trillion today, up more than $1 trillion in a little over one year and almost $500 billion since the Fed’s RRP peaked in size back in April.
So, the decline in the size of the RRP is not due to shrinking money market assets, it’s down to a shift in those assets from RRP to Treasury Bills. Of course, money market funds are shifting money in favor of Treasury Bills for the simple reason that available yields are higher:

Source: Bloomberg
This chart shows the yield on a 1-month Treasury Bill compared to the Fed Funds Effective rate in basis points (1 basis point = 0.01%). As you can see here, since roughly May, yields in 1-month T-Bills have generally been a few basis points higher than the Fed Funds Rates, prompting money market funds to shift assets away from the RRP in favor of T-Bills.
And, since 3-month T-Bills tend to offer a bit more yield than 1-month bills, the yield advantage of shifting from RRP to Bills is even a bit higher than my chart suggests.
This is why if you look at holdings of any major US money market fund you’ll see a mix of Bills including many 1 to 3-month T-Bills.
I’ve written about the Fed’s balance sheet, the RRP and the US government’s ballooning deficit on a few occasions including my May 30th post “Crowding Out.”
Simply put, in terms of impact on the US economy, the accelerating decline in RRP is the least damaging outcome Treasury and the Federal Reserve could have hoped for.
However, that doesn’t mean there aren’t significant concerns:
The RRP, Bank Reserves, TGA and QT
Sorry, I know that sub-head contains a lot of acronyms; however, bear with me and let me explain.
Following the debt ceiling deal in early June, the Treasury was desperate to borrow money by issuing new debt to replenish the Treasury General Account (TGA), which is essentially the US government’s checking account held at the Fed.
At the end of May, the TGA contained less than $50 billion, compared to almost $740 billion as of last Thursday’s close.
The TGA is a liability on the Fed’s balance sheet. And, since the Fed’s assets and liabilities must balance, that $700 billion increase in the Fed’s liabilities (the rising TGA) must be offset by an increase in the size of assets held by the Fed, a decline in liabilities or some combination of those two.
The issue is further complicated by quantitative tightening (QT):
Source: Bloomberg
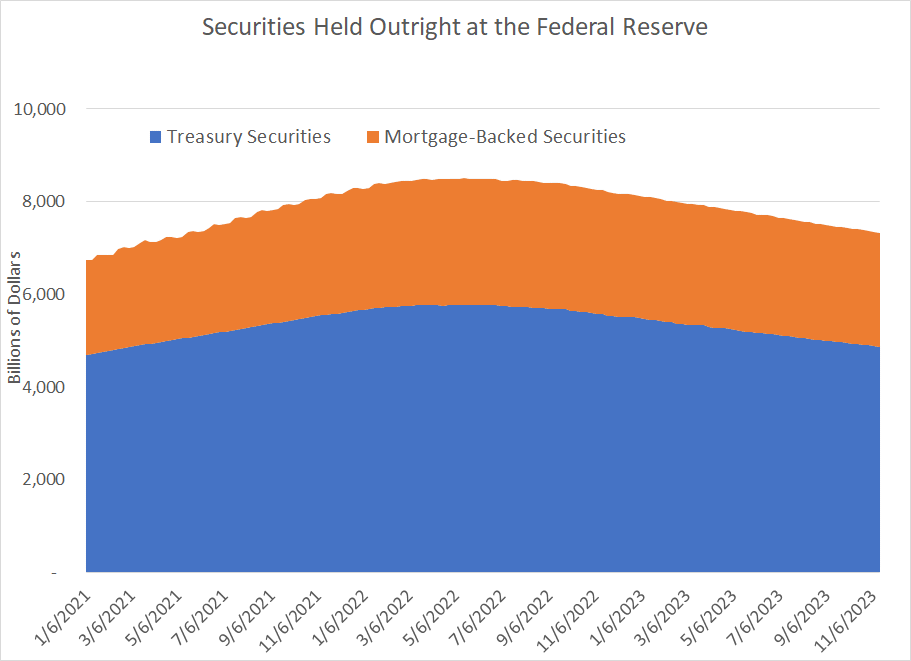
When it’s Quantitative Easing (QE), the Fed purchases Treasuries and mortgage-backed securities (MBS) outright to hold as an asset on its balance sheet. This drives down prevailing interest rates and, theoretically, stimulates economic activity.
Quantitative Tightening (QT) is the opposite; at the peak in mid-May 2022, the Fed held more than $8.5 trillion in Treasuries and MBS combined. Today, that’s closer to $7.33 trillion, a decline of almost $1.2 trillion.
Again, securities held on the Fed’s balance sheet represent an asset, so a decline in the size of this asset over time must be counterbalanced by either a rise in the value of other assets or a commensurate decline in Federal Reserve liabilities.
Simply put, there are a lot of moving parts to consider with the Fed’s balance sheet this year centered on two main issues – the ongoing, steady decline in the size of the Fed’s assets caused by QT coupled with the rise in the Fed’s liabilities since spring driven by the Treasury’s need to replenish the TGA and fund an eye-popping budget deficit.
The fall in Fed assets coupled with the increase in liabilities are reinforcing trends.
The combined impact of both must be balanced by either a decline in the Fed’s other liabilities (apart from TGA), a rise in the Fed’s other assets (beyond declining securities held outright) or some combination of the two.
The two most important balancing factors are:
The Reverse Repurchase (RRP) facility.
Bank Reserves.
Both are liabilities held on the Fed’s balance sheet and they’re really the only two factors of sufficient size to offset the TGA and QT trends I’ve just outlined. As of the end of May, the RRP represented around $2.6 trillion in Fed liabilities and total bank reserves held at the Fed were approximately $3.31 trillion.
The economic impact of shifts in these two Fed liabilities are very different.
RRP is less impactful. The fact money market funds have shifted roughly $1.4 trillion in assets from the RRP facility at the Fed to T-Bills since April really has little economic impact.
Generally, money market assets represent low velocity money – this is cash that’s passively earning interest rather than being deployed to fund business capital spending, investment, or consumer spending.
Indeed, from the Treasury’s perspective, you could say the decline in RRP is great news.
When a money market fund shifts assets from the RRP to buy Treasury Bills, they help to fund the US government’s deficit and replenish (and maintain) the TGA. As I’ve just outlined, Treasury Secretary Janet Yellen’s dream scenario is exactly what’s happened this year.
The bad news is that money market funds can’t buy longer-term Treasury debt such as 5-year, 10-year or 30-year bonds. That’s forced Treasury to rely heavily on issuing short-term debt like 1 and 3-month Treasury Bills to fund the deficit and replenish the TGA.
Take a look:
Source: Bloomberg, Securities Industry and Financial Markets Association (SIFMA)
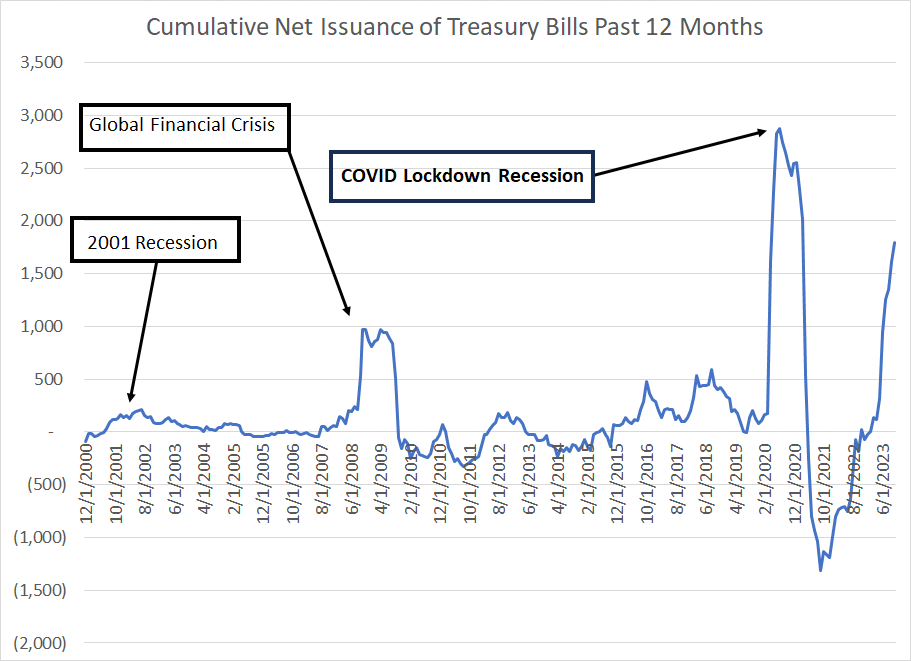
This chart shows net US Treasury Bill issuance since 2000 on a trailing 12-month basis – a positive number indicates Treasury raising new money by issuing short-term debt (Treasury Bills). By new money I mean this figure is the amount raised AFTER money needed to retire maturing bills.
So, as you can see, Treasury net bill issuance usually rises during economic downturns (recessions) as the government applies fiscal stimulus. That happened in 2001, during the 2007-09 Great Recession and during the brief-yet-severe COVID lockdown recession of 2020.
Over the 12 months ended October 31st, Treasury has issued a net $1.79 trillion in Treasury Bills. However, unlike prior experience, the economy is (allegedly) strong.
Part of that’s due to the unprecedented US government budget deficit, at least in peacetime.
An equally important factor is Treasury has been forced to rely heavily on short term debt issues – Treasury Bills -- to ensure their yawning borrowing requirements can be met through a decline in the RRP rather than bank reserves.
Here’s a different way to look at it:
Source: Bloomberg, SIFMA
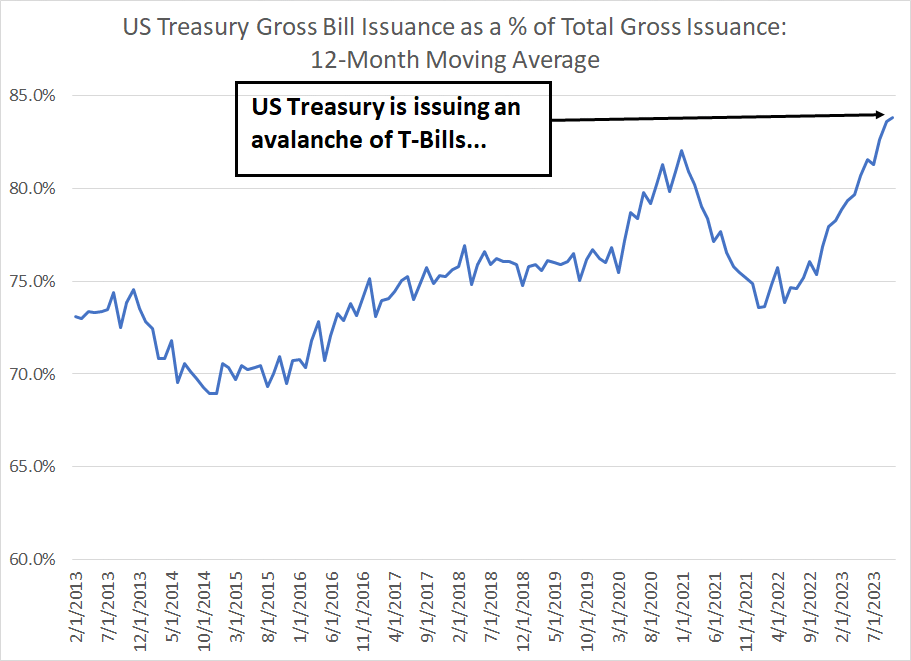
This chart shows the 12-month (1-year) moving average of gross T-Bill issuance compared to total gross Treasury issuance of bonds, notes and bills.
As you can see, we’re at the highest levels in over a decade with close to 84% of gross Treasury issuance from short-term T-Bills. Recent Treasury quarterly refunding estimates suggest that pattern is likely to continue through the balance of this year and into Q1 2024 as well.
As I said, the upside of this is that Treasury has been able to issue bills to cover its funding needs rather than longer-term debt, meaning that most of the money needed to fund the deficit, and the replenishment of the TGA, has come from money market funds and the RRP.
However, there are also some glaring issues with relying on these short term “payday” loans to fund the federal government’s profligacy.
After all, $1.268 trillion, the current size of RRP, represents a ton of cash in absolute terms.
However, just remember that RRP has already drained to the tune of more than $1.4 trillion in just over 6 months! That can’t happen again over the next six months because there just isn’t enough cash left in RRP.
And Treasury’s latest quarterly refunding documents project the government will raise some $437.45 billion in new money by issuing T-Bills in Q4 2023 to be followed by $467.60 billion in net issuance for Q1 2024 – that’s more than $900 billion in new T-Bill funding – net NOT gross issuance – over the six-month period ended March 31, 2024.
And that brings a major risk to the fore:
Big Tails
For years, investors, especially those focused on equity markets, all-but ignored US Treasury auctions.
After all, rates were depressed across the yield curve and, through several rounds of quantitative easing since the 2007-09 financial crisis, the Fed was buying bonds to hold on its own balance sheet as I highlighted earlier.
Few worried about the US government’s ability to fund sizable deficits at rock-bottom rates.
Of course, that’s all changed amid the surge in inflation since 2020, the most aggressive rate hiking campaign in 40 years since the spring of 2022 and the Fed’s ongoing quantitative tightening.
And, lately, there have been some sizable apparent cracks in demand for US government bonds (notes and bonds as opposed to T-Bills):
Source: Bloomberg
When the government auctions new Treasury Bonds there are several different ways to measure demand for the debt. One is to look at the percentage of the issue that’s purchased by primary dealers compared to the recent trend.
Let me explain:
When the Treasury auctions new debt, there are several different types of investors who submit bids to buy the newly issued securities. You have direct bidders, which include categories of buyers like insurance companies, mutual funds, hedge funds and pension funds.
You also have indirect bidders which are buyers who buy Treasuries through an intermediary – this category would include buying by foreign central banks.
And then you have the Primary Dealers. These are large financial institutions like JP Morgan Chase (NYSE: JPM) which are required to participate in, and make markets for, Treasury bonds issued through auctions.
Generally, if direct bidders absorb a large portion of new bond issues at auction it suggests demand for Treasuries from investors is strong. And if indirect bidders grab a large portion of new bond issues it suggests foreign central banks are buying Treasuries. Generally, either of thee outcomes represent good news and suggest the US government isn’t struggling to find buyers for the debt it issues.
However, when primary dealers get stuck with a large portion of new Treasury issuance it means real demand was weak, forcing these large financial institutions to perform the role of stepping in to provide liquidity and make a market in the newly issued debt.
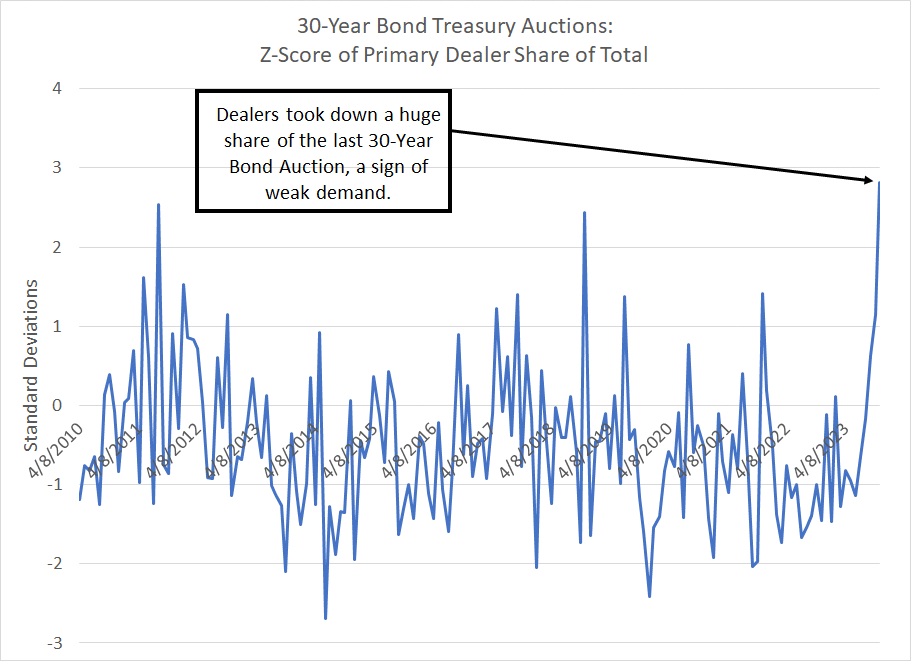
The chart I’ve presented above examines primary dealer participation in long bond auctions since 2010. Specifically, I’m looking at the Z-Score of primary dealer’s share of each 30-year Treasury Bond issue compared to the trailing 2-year (24-month) moving average. As a reminder, the Z-Score shows primary dealer participation in terms of standard deviations above or below that two-year average.
Bottom line: A high reading here suggests weak demand at auction, forcing primary dealers to step in and get “stuck” with a large portion of newly issued Treasury bonds.
And, as you can see, the last time the Treasury issued 30-year bonds was on November 9th when primary dealers ended up with almost one-quarter of the entire issue – that’s almost 2.2 standard deviations above the 24-month average. On this basis, that’s the worst auction result on my chart.
The result: Just before the bidding deadline at 1 PM on November 9th the “when-issued” yield for the 30-Year Treasury stood at 4.716% however the actual yield needed to sell the new debt was 4.769%, a “tail” of 5.3 basis points. And while an extra 0.053% yield may not seem like a lot, there has only been one other 30-year auction in the past decade with a tail of more than 5 basis points.
And when primary dealers get stuck with a high portion of a new Treasury issue, they must offload or hedge some of that risk – they must hedge their exposure to rising rates. That explains the big spike in 30-year yields from around 4.7% at noon on Thursday November 9th to over 4.83% that afternoon.
So, this leaves Treasury, the Fed and the US economy in a sticky situation:
Rates, Inflation, Recession
Ultimately, Treasury would likely prefer to issue more long-term debt to fund the deficit rather than relying so heavily on short-term bills. That’s particularly true since it appears that relying on money market funds to fund the Treasury’s entire deficit may be reaching its limits given the big drain in RRP since last spring’s peak.
However, as the recent 30-year Treasury auction makes clear, the real demand for investors for this longer-term paper just isn’t sufficient, at least not at the current rates or level of supply (elevated size of recent auctions).
So, it’s possible even higher long-term interest rates – above the recent near 5% peak on the 10-year or the 5.11% peak on the 30-year might be necessary to attract additional demand and fund the deficit. However, Treasuries aren’t just your run-of-the-mill market – yields paid on US government debt have vast implications for the rest of the economy and serve as the basis for pricing credit on all manner of corporate bonds and consumer debt.
In my view, we’re already seeing clear evidence elevated rates are having a chilling impact on the US economy. Indeed, the Fed’s recent recognition rising long-term rates could substitute for additional Fed Funds hikes is a pretty clear admission of that link.
Simply put, if the economy struggles with 5% 10-year yields, just imagine what would happen at 6% or 7%.
Further, the money to buy longer-term Treasuries still has to come from somewhere. And, in the absence of a new round of QE from the Fed, that’s likely to be investors buying bonds using funds on deposit in the commercial banking system.
That means bank reserves:
Source: Bloomberg, Federal Reserve
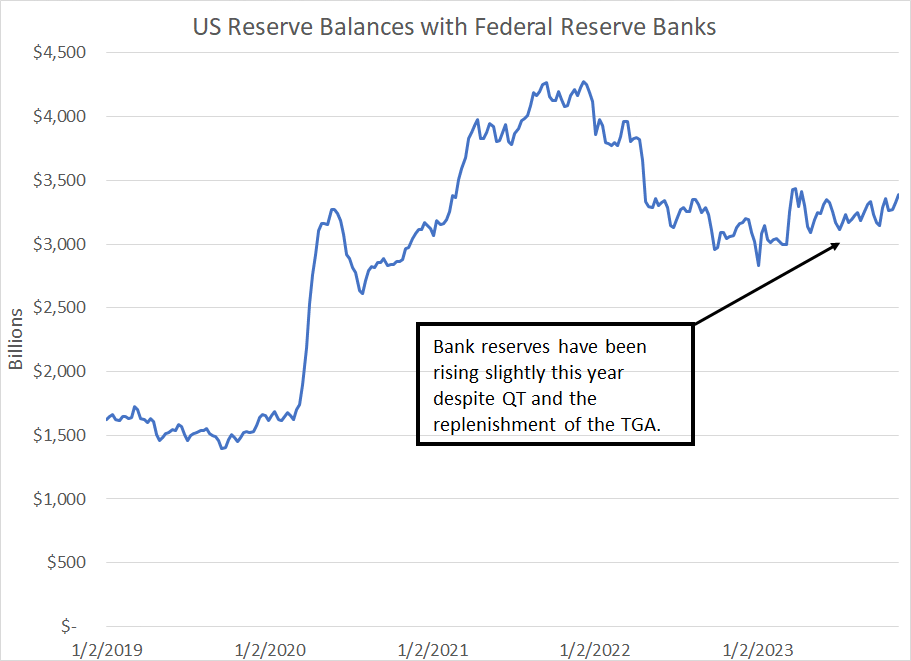
Earlier on in this update I noted that draining the RRP is a relatively benign way to offset QT and the rising TGA, because money market funds are low velocity money.
The exact opposite is true of bank reserves., This money, held in the Federal Reserve System (at the central bank) underpins all lending and credit in the US financial system – it’s part of what’s called “high-powered money.”
As you can see, the RRP has done all the heavy-lifting, and then some, of offsetting QT and the rise in the TGA this year – indeed, bank reserves have generally been rising. Thus, so far there’s been a more limited impact of all of these trends on real economic activity than would otherwise be the case.
At some point though, there’s a tipping point. The shift in money market funds from RRP will no longer be adequate to offset both declining Fed assets (QT) and money needed to maintain the TGA (fund the Federal deficit).
If it’s a gradual adjustment, the economy might be able to absorb the credit tightening from a decline in bank reserves. However, there’s real risk here that it’s not gradual – a more rapid drop in reserves leads to a non-linear tightening in credit conditions and an air pocket for the economy.
And, that’s how you go from a mild recession to a very nasty one in short order.
On top of that, you also have this:

Source: Bloomberg, Treasury
This chart shows the interest Treasury pays on the national debt.
In nominal dollar terms (blue line, left-hand scale) Treasury’s interest bill alone currently stands just shy of $1 trillion annualized, near double the level of late 2020.
Even if we measure interest in terms of share of US GDP, it’s at 3.55%, which is the highest in almost a quarter century. Given Treasury’s massive borrowing needs, persistent deficits and soaring rates both the dollar interest cost and the percentage of GDP are set to rise much further in 2024.
Of course, rising Treasury interest costs put further strain on the economy, driving a need to borrow even more and, eventually, drain bank reserves, crowding out private sector credit, investment, and economic activity.
Now, some might say that the Fed is committed to bringing down inflation and will be willing to push rates higher for longer to meet its goals regardless of the outcome for the economy. They’re willing to accept “pain” in exchange for inflation credibility.
In my view that’s unlikely – yes, the central bank has been aggressively raising rates since the second half of 2022, looking “tough,” but there’s been no pain yet!
Bank reserves are higher, the Treasury is funding with T-Bills and unemployment remains low.
We are beginning to see some very real cracks in the economy and some real concerns about the future of US corporate earnings – weak guidance through the recent earnings season and falling estimates. The unemployment rate is rising, close to triggering the Sahm Rule for a recession and the recent rise in continuing and initial claims data suggests that will trigger by the end of this year or early in 2024.
I continue to look for more upside in stocks through year-end.
However, make no mistake about it, the winds are shifting and the current trajectories of US economic growth, government borrowing, and interest rates are unsustainable.
Something has got to give.
By early 2024 I suspect the Fed’s main concern will shift from inflation to economic growth and the consensus on Wall Street will move from higher for longer rates to a debate over the speed of cuts. There’s also a very real risk the consensus could shift from “soft landing” to “mild recession” and then more severe recession over the course of 2024.
That’s a hostile environment for stocks, a tailwind for the beleaguered Treasury market and, given likely still elevated inflation, a 70’s-style stagflation tailwind for commodity prices.
DISCLAIMER: This article is not investment advice and represents the opinions of its author, Elliott Gue. The Free Market Speculator is NOT a securities broker/dealer or an investment advisor. You are responsible for your own investment decisions. All information contained in our newsletters and posts should be independently verified with the companies mentioned, and readers should always conduct their own research and due diligence and consider obtaining professional advice before making any investment decision.