


Two Powerful Investment Principles
Some thoughts on oil, energy stocks, emerging markets and the summer catch-up

Editor’s Note: I’m adding two new recommendations to the model portfolio this week. Paid tier readers of Free Market Speculator can check out the exact recommendations in the Actions to Take section below.
This summer, I’m also offering 30-day free trials to the paid tier via this link:
— EG
As expected, the Federal Reserve left rates unchanged in a target range of 4.25% to 4.50% this week while reiterating elevated uncertainty surrounding both sides of the central bank’s dual mandate, inflation and the labor market.
Given the widely anticipated decision to keep rates unchanged, investors were focused on the Fed’s quarterly Summary of Economic Projections (SEP) outlining economic projections of Federal Reserve Board members and Federal Reserve Bank Presidents.
There were some shifts in the June SEP with Fed members now projecting higher inflation, slower economic growth and higher unemployment than in March.
Specifically, in the March SEP, median real (inflation-adjusted) GDP growth was expected to be +1.7% this year and +1.8% in 2026 compared to +1.4% and +1.6% respectively in the June projections.
Fed members also increased expectations for the yearend unemployment rate this year by +0.1% to 4.5% and for 2026 by +0.2% from 4.3% to 4.5%.
Finally, the June SEP also included a significant bump in inflation expectations to a median of +3.1% for the core Personal Consumption Expenditures (PCE) this year, up a full 0.3% from March, falling to 2.4% in 2026.
However, what didn’t change was the outlook for policy this year – the median expectation is for rates to end 2025 at 3.9%, which would imply two 25 basis point cuts this year (0.50% in total), the same as in March. In this month’s dot-plot, as in March, there’s a wide distribution of expectations for policy with 7 of the 19 Fed members included in the projections expecting rates to remain unchanged through 2025, eight expecting two cuts and two members expecting three 25 basis point cuts.
You could say this represents a slight hawkish tilt compared to March when only 4 Fed members expected rates to remain unchanged, nine expected the central bank to cut twice, four expected one 25 basis point cut and the same two “dots” at 3 cuts for the year.
The June SEP represents a hat tip in the direction of “stagflation” – slower growth coupled with higher inflation, necessitating higher rates to forestall any rise in long-term inflation expectations. Indeed, the central bank appears to be parroting the consensus view – according to Bank of America’s June Global Fund Managers Survey, a whopping 75% of those surveyed expect stagflation, defined as above-trend inflation and below-trend economic growth.
With those points in mind, it's worth remembering two core truths about financial markets:
A known fundamental is a useless fundamental.
When the crowd is leaning heavily in one direction, it’s time to think as a contrarian, looking for opportunities to fade the consensus.
Let’s start with the first of those principles:
What’s Known is Useless
The news and the incoming economic data are meaningless in isolation.
What really matters is how markets react to the news and that’s driven by how the incoming news or data compares to market expectations. Hence, while there was a hawkish tilt to the June SEP, the market shrugged – as of the market close on June 17th, the day before the Fed meeting, the Fed Funds futures market was pricing in 83.3% probability the Fed leaves rates unchanged at its next meeting in late July, compared to 89.7% probability at the close on June 18th.
And take a look at expectations for rates as of the Fed’s final meeting this year on December 10, 2025:
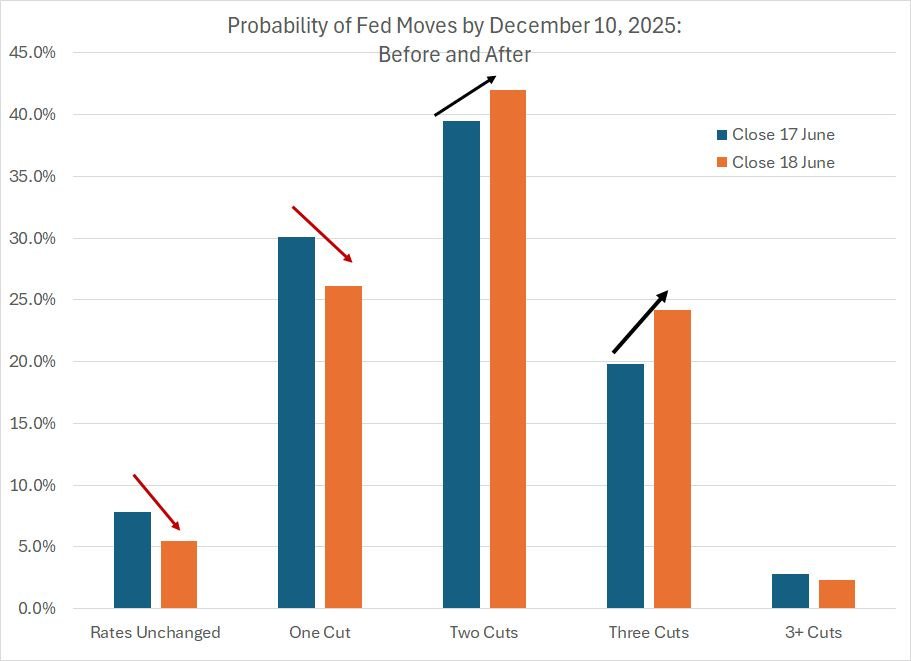
Source: CME Group FedWatch
As you can see, the Fed Fund futures market is now looking at slightly lower probability the Fed remains on hold through the end of this year and slightly higher probability the Fed cuts 50 to 75 basis points through the balance of 2025. That’s a (very) modest dovish shift in the Fed Funds futures market for the back half of this year.
And we’ve all heard the bearish case for Treasuries.
Each Federal Reserve Bank, representing different regions of the US, collects data on economic conditions through surveys of businesses and economists in their region into a release that’s commonly called the “Beige Book.”
Here’s the most recent commentary on prices from the May Beige Book:
Prices have increased at a moderate pace since the previous report. There were widespread reports of contacts expecting costs and prices to rise at a faster rate going forward. A few Districts described these expected cost increases as strong, significant, or substantial. All District reports indicated that higher tariff rates were putting upward pressure on costs and prices. However, contacts’ responses to these higher costs varied, including increasing prices on affected items, increasing prices on all items, reducing profit margins, and adding temporary fees or surcharges. Contacts that plan to pass along tariff-related costs expect to do so within three months.
Source: Federal Reserve, May Beige Book
As you can see, there’s a widespread view tariffs will put upward pressure on prices and most businesses that plan to pass along tariff-related costs to consumers plan to do so within 3 months.
Of course, with inflation still well above the Fed’s 2% target, this puts the central bank in a tough spot and their preferred path appears to be to do nothing while awaiting greater clarity of the duration of any tariff-related bump in inflation. In Chairman Jerome Powell’s Press Conference this week, he again raised the specter of deterioration in both sides of the Fed’s dual mandate – above-target inflation and weaker labor market conditions.
Powell said:
We may find ourselves in the challenging scenario in which our dual-mandate goals are in tension. If that were to occur, we would consider how far the economy is from each goal, and the potentially different time horizons over which those respective gaps would be anticipated to close. For the time being, we are well positioned to wait to learn more about the likely course of the economy before considering any adjustments to our policy stance.
Source: Federal Reserve June 18 Press Conference; Emphasis added is my own.
If the University of Michigan’s survey of inflation expectations is to be believed, US consumers also believe there’s a substantial jump in US inflation just around the corner:

Source: Federal Reserve Bank of St. Louis
In May 12-month inflation expectations in the University of Michigan survey soared to 6.5% from 5.0% in March and just 2.8% at the end of last year.
As you can see, you must go back more than 40 years to 1981, when the US was in the latter stages of the Great Inflation period of the 1970s, to find higher one-year forward inflation expectations.
And then, of course, there’s the so-called “Big Beautiful Bill” currently making its way through Congress. The bond bears will argue the increase in deficits caused by this legislation will require a substantial increase in the national debt; yields will need to rise to reflect the increase in Treasury supply and the need to incentive buyers with higher rates.
Higher inflation, out-of-control deficit spending and let’s throw in a Moody’s downgrade of the US sovereign credit rating for good measure – it’s tough to image a more hostile environment for US government bonds.
However, there’s one little problem – Treasuries aren’t selling off and yields aren’t rising:
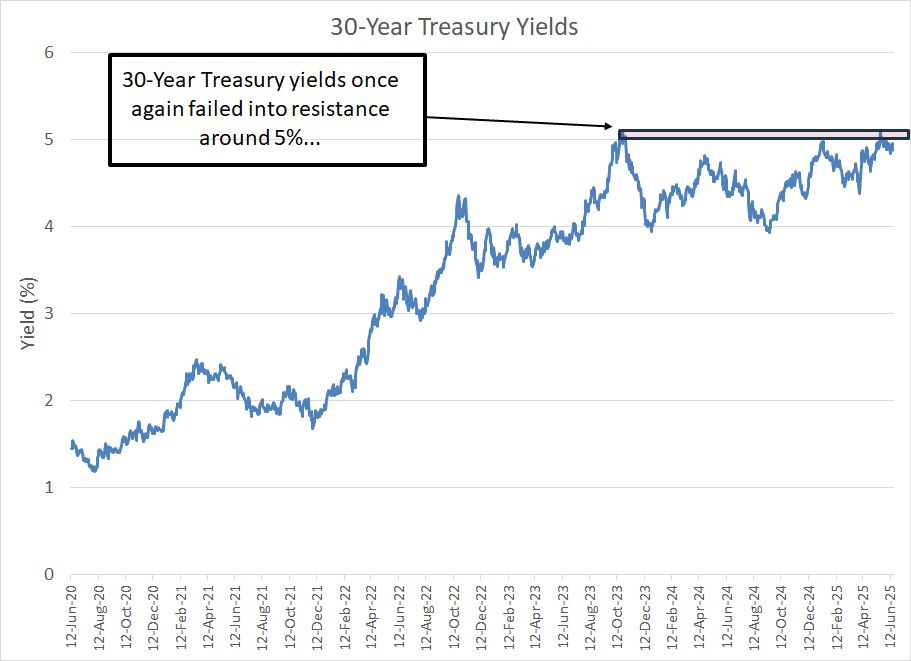
As you can see, the 30-year Treasury yield rose above 5% in late May just as it did back in late 2023. Once again, yields failed to break higher and reversed lower to below 4.9% as of Wednesday’s close.
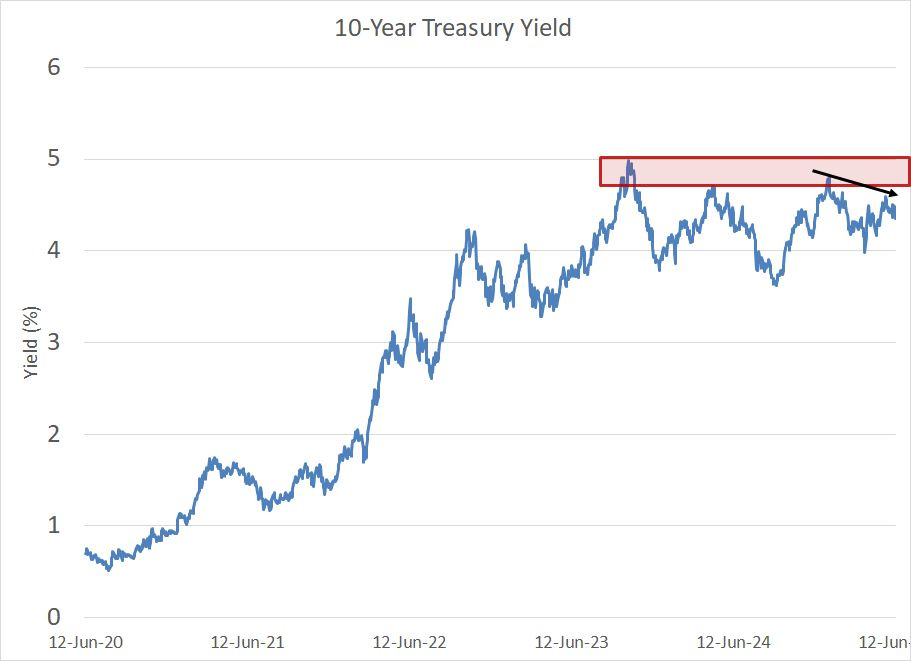
The more widely followed 10-Year Treasury yield didn’t even manage to approach its January peak again in recent weeks let alone the late 2023 cycle highs:
As I said, none of the bearish arguments for Treasuries are a big secret. The mainstream media has talked about inflation, tariffs, trade policy and, most recently, the Big Beautiful Bill endlessly all year.
So, why aren’t yields acting like they “should” given these fundamentals and this narrative?
The truth is that I have no idea.
However, one of two things – or some combination of the two – must be true.
First, perhaps the market is telling us that all the worst possible news is already priced in the bond market.
Or, second, perhaps the market is telling us the consensus narrative is wrong.
That could mean that the market sees risk the economy will weaken more than expected this year, forcing the Fed’s hand. Or it could mean the market is already looking forward to the middle of next year when it’s highly likely the Federal Reserve will get a new Chair who’s likely to push the central bank in a more dovish direction.
Regardless, when markets don’t behave as they’re supposed to – when price action doesn’t fit the narrative – then it’s time to sit up and take notice. These are often times when the crowd is leaning in the wrong direction and the path of least resistance is against the consensus view.
And that brings me to the second, related point:
A Contrarian’s Dream
With so many investors positioned to favor rising rates – weakness in bonds – I believe Treasuries are primed for a significant reversal that would catch the bond bears on the wrong side of that trade (higher prices, falling yields).
However, bonds aren’t the only market where we’re seeing extremes in sentiment right now.
Take a look:
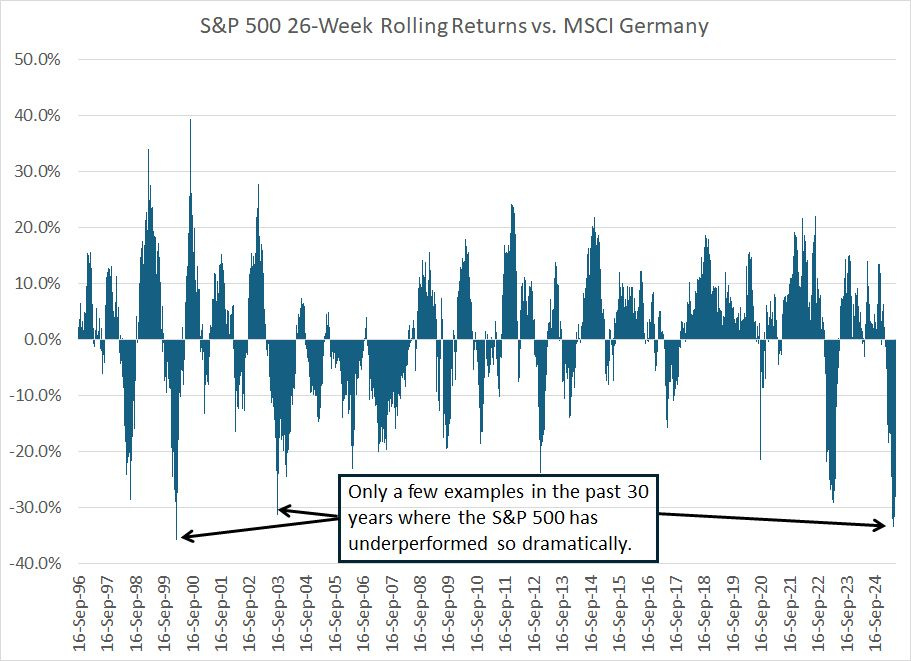
To create this chart, I examined rolling 26-week (six month) total returns for the SPDR S&P 500 ETF (NYSE: SPY) and the iShares Germany ETF (NYSE: EWG), which tracks the MSCI Germany Index, since September 1996.
This chart shows the 26-week performance of the S&P 500 less the 26-week performance of EWG such that a positive bar represents S&P 500 outperformance and a negative bar the opposite. At one point in May this year, the S&P 500 was underperforming Germany by more than 33 percentage points over a trailing 6-month time frame.
There are only a few examples of similar extremes over the past 30 years from the late 1990s up through the mid-2000s. And, since 2012 or so, this simple metric has spent most of the time above zero, which reflects the long era of US exceptionalism I’ve written about several times in this service.
I believe three points are worth noting.
First, periods of extreme S&P 500 underperformance are historically followed by a snap-back move for US stocks.
For example, at one point in the summer of 1998 the S&P 500 underperformed German stocks by just under 30% on this basis. By early 1999, the US had flipped the script, outperforming Germany by more than 30% over a trailing 6-month time frame.
Similar snap backs are evident following periods of extraordinary underperformance in early 2000, late 2003 and April 2023.
Financial markets are mean reverting, which is a fancy way of saying extreme moves are often followed by a move back towards a long-term average level. In a nutshell, that’s what we’re seeing in this chart – US and German stocks will tend to move in the same direction, so when there’s a major divergence between the two markets that will tend to correct over time.
I believe that’s what’s likely to happen here at some point over the next six months. This idea is further backed up by the fact the latest Bank of America Global Fund Manager survey shows investors the most underweight the US dollar since early 2005 combined with significant overweight positions in Eurozone stocks.
Second, there are two important ways extreme relative underperformance between the US and Germany, and by extension US and EU stocks, can mean-revert.
The US could play catch-up, or Germany could play catch-down.
I believe the former is more likely.
Consider the big swing in my chart above from the summer of 1998 through early 1999. US underperformance in the summer of 1998 was the product of strength in German equities, rising more than 50% over a period of just 6 months at one point leading up to that summer. US stocks were still strong, rising more than 25%.
Both markets saw a significant sell-off in the late summer and early autumn months and then recovered. However, the US stock market experienced a more powerful rally from the October lows into early 1999 than the German market, accounting for the big swing in my performance chart above.
Now, look at the chart in late 2003.
At one point in September 2003, US stocks underperformed their German counterparts by more than 30 percentage points.
Both the US and German markets were rallying at this time. Equity markets were in the early stages of recovery from the vicious bear market that lasted from March 2000 through late 2002; some of the most powerful rallies of the entire cycle tend to happen in the opening months of a new bull market.
However, German stocks performed better. In the six months ended in September 2003, the German stock market was up more than 50% compared to 20% to 25% for the S&P 500 over a similar time frame.
Both the S&P 500 and EWG rallied from September 2003 into early 2004, traded sideways for a few months and then took off again into late 2004 and early 2005. This bull market didn’t end until the Great Recession and financial crisis period kicked off in the summer and fall of 2007.
However, the US market outperformed Germany for much of 2004, rising at a faster pace early in the year and then holding up better through the consolidation phase through the summer of 2004.
Also, note that for most of the period from 2003 through 2008, my simple indicator spent most of the time below zero, a sign the German stock market generally outperformed the S&P 500 over this multi-year period. Examples of S&P 500 outperformance over six-month holding periods are few and far between in this era.
And that brings me to my third and final point – the market regime matters.
This year, I’ve written extensively about what I call the “Great Cycle.” Simply put, if you look back through post-war market history, you’ll find multi-year periods of US dollar strength, US equity market exceptionalism and restrained inflation and commodity prices. Historically, those periods are followed by multi-year cycles favoring a weaker dollar, strength in global equity markets relative to the US and strength in commodity prices.
I believe the Great Cycle has been turning over the past few years in favor of a phase that favors a weaker dollar, strength in commodities and non-US stocks.
We went through a similar turn in the Great Cycle between the late 1990s and early 2000s, which is evident on my chart of relative US and German stock market performance.
In particular, look at my chart and you’ll see extreme bouts of weakness in the S&P 500 relative to Germany in the summer of 1998, early 2000 and late 2003. This pattern rhymes with episodes of US equity underperformance in the autumn of 2020, early 2023 and May of this year.
The extreme periods of US market underperformance in the late 1990s and early 2000’s ultimately gave way to a more consistent period of S&P 500 underperformance from 2003 through 2008 and, arguably, into early 2013. The shifting fortunes for technology stocks, dominated by the US, explain a good bit of this change – from high valuations for US stocks relative to global peers in the late 1990s to a more normal relative valuation coming out of the financial crisis in 2009-12.
I’m looking for a similar shift in the market regime and the Great Cycle in coming years.
It will not be a smooth ride.
In 2003-2008 when global stocks dominated their US peers in the context of a global rally from 2002 to 2007, there were still episodes of US market outperformance that lasted for a few months or a few quarters. And in 2008-12 while international stocks continued to beat the S&P 500 generally, we began to see some more pronounced periods of American equity outperformance.
Right now, I believe we’re in for once of those countertrend catch-up periods for the US stock market amid a longer-term relative bull market for international stocks. I suspect this will take the form of more restrained gains for some global equity markets this summer, particularly European stocks which have exhibited the most extreme outperformance of late.
Meanwhile, I believe the S&P 500, and its erstwhile market leaders in technology, could play catch up by closing some of the performance gap we saw through the first five months of 2025.
Let’s start with this chart:
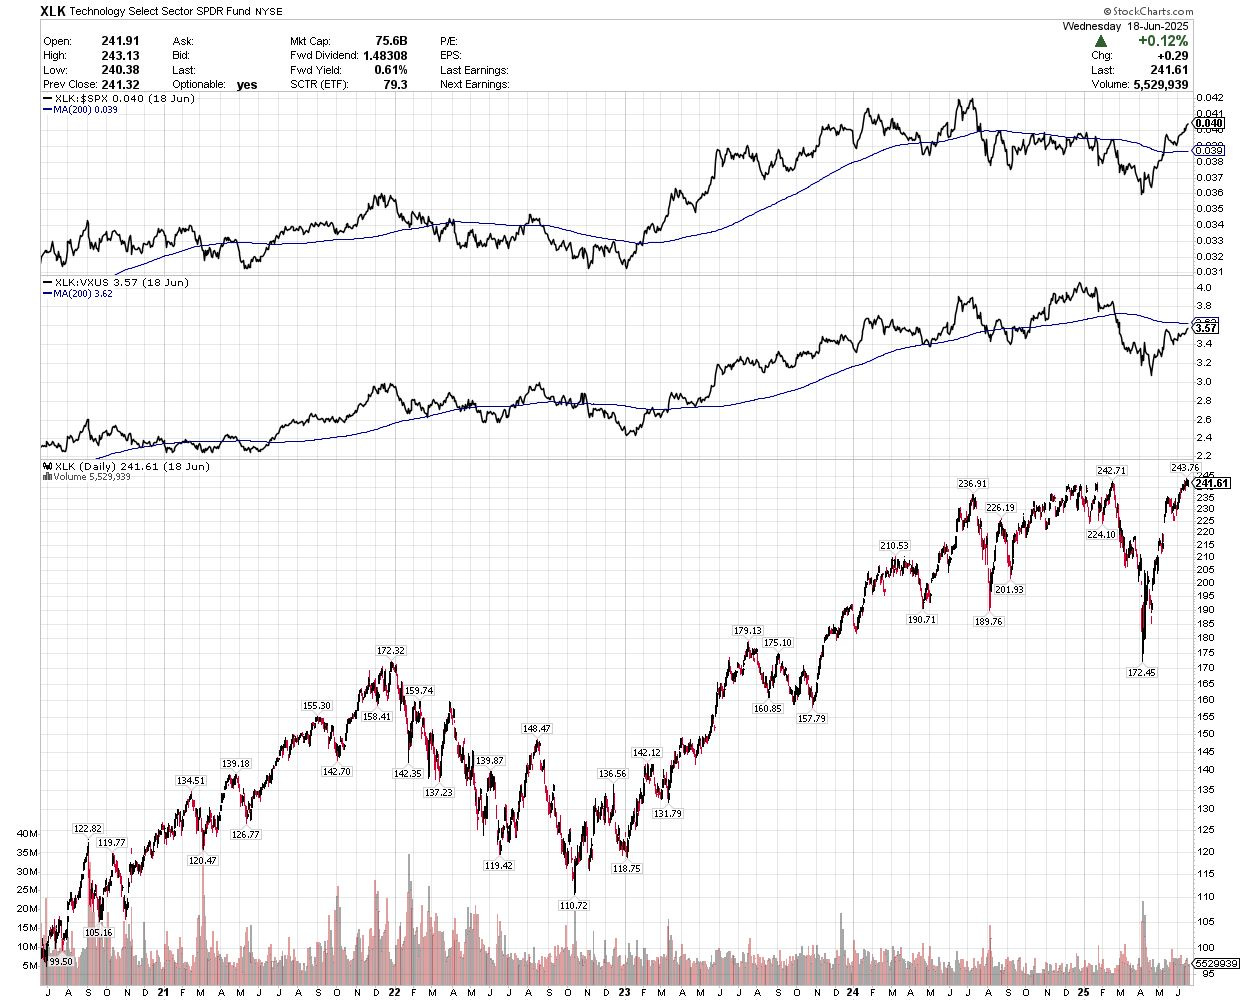
Source: Chart Courtesy of StockCharts.Com
This chart shows the SPDR Technology ETF (NYE: XLK), which tracks technology stocks in the S&P 500. The top pane of my chart shows technology stocks relative to the S&P 500 while the middle pane shows US tech stocks relative to the Vanguard Total International ex-US ETF (NSDQ: VXUS), which tracks all global stocks excluding the US.
US Technology stocks are, once again, close to all-time high, near a level that was first reached in the summer of 2024 and again early this year before the March-April tariff panic.
However, on a relative basis, tech stocks have been underperforming for almost a year now, since July 2024. That’s because while tech is near its all-time highs, the S&P 500 is significantly higher than where it was trading in the summer of last year. On a relative basis, however, tech bottomed in early April this year and is well on its way to last summer’s relative price peak.
Now, look at that middle pane showing tech relative to global markets excluding the US. Tech began underperforming global markets right at the end of 2024 and bottomed on a relative basis in late April. However, that relative strength chart remains far below its December 2024 peak.
Technology stocks are far and away the largest sector in the S&P 500 and, if we include tech-attached growth names like Amazon.Com (NSDQ: AMZN) and Meta (NSDQ: META) the group is even more dominant. So, realistically, if the S&P 500 hits new all-time highs in coming months, technology will need to participate and see fresh highs.
By extension, if the extreme degree of international stock outperformance relative to the S&P 500 is to mean-revert then we’ll need to see the technology stocks that dominate the US market see additional strength relative to global stocks in coming months.
Again, let me reiterate that my longer-term view remains international stocks will outperform US stocks over the next few years and, accordingly, I believe returns for technology stocks will be lower in the next few years than they’ve been since 2019. However, much like the historical examples I just outlined, I believe the pendulum has swung too far in that direction for now, and we’re due a significant countertrend move.
Accordingly, I’m adding some exposure to technology to the model portfolio this issue via a name I see benefiting from both the ongoing data center build-out to support artificial intelligence (AI) and a broader recovery in industrial sectors of the economy. Keep in mind, the only direct technology exposure we hold in the portfolio right now is via Oracle (NSDQ: ORCL), a position that’s now up almost 100% from recommendation in late 2023.
Our modest and selective tech exposure coupled with significant global market exposure has helped the model portfolio outperform since last summer. However, for now, I’m no longer comfortable with such dramatic underweight in tech.
And that brings me to this:
The Two “E’s”
I just showed you the extreme level of outperformance we’ve seen from German stocks over the past 6 months relative to the S&P 500. And, to be clear I’m using Germany as a proxy for European stocks for the simple reason that I have a longer price history for EWG than for ETFs tracking Europe more broadly. Moreover, Germany is largest equity market, and the largest economy, in the Eurozone.
And while global stocks have outperformed the US more broadly, Europe’s relative strength has been a standout.
That brings me to the first of the two “E’s,” which is emerging markets:

This chart shows 26-week rolling returns for the S&P 500 less returns for the Emerging Markets ETF (NYSE: EEM), which tracks the MSCI Emerging Markets Index, since 2003.
Emerging market stocks have outperformed the US this year. However, even during the long period of US equity exceptionalism following the financial crisis in 2009, there are plenty of examples where emerging markets beat the S&P 500 by a larger percentage over periods of 6 months or more than is the case today.
And if we go back to the time of the last Great Cycle favoring global markets – the period from 2003 to 2009 on this chart – there were prolonged bouts of emerging market outperformance three or more times larger than anything we’ve seen this year.
In other words, emerging market stocks appear less stretched than European equities and I see room for rotation favoring these markets this year even if Europe takes a breather.
In this issue, I’m bolstering our emerging market exposure in the model portfolio somewhat via a new recommendation.
And that brings me to the second “E,” namely:
The Summer of Energy
I’ve been pounding the table on natural gas for more than a year now.
Last year, with front-month gas prices under $2.00/MMBtu I saw signs of improvement in longer-term gas prices and I wrote that select US natural gas focused exploration and production (E&Ps) companies represented the best value in the energy space. I even called 2025 the “Year of Natural Gas” thanks, in large part, to the buildout of 4 billion cubic feet per day (bcf/day) of new liquefied natural gas (LNG) export capacity out of the US between Q4 2024 and Q1 2026.
That theme has worked and my natural gas E&P recommendation in the model portfolio is now up 22.7% year-to-date and 46.4% since my initial recommendation including dividends.
However, there’s a simple truth about energy stocks in the S&P 500, and the S&P 500 Energy Index, revealed in this chart:
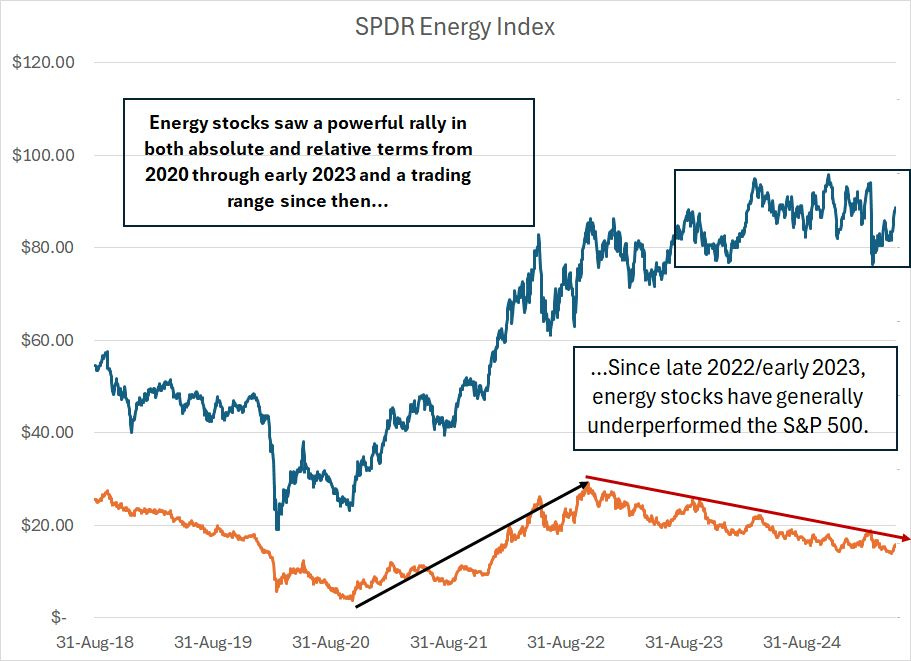
Natural gas levered stocks represent only a small portion of the S&P 500 Energy Index and crude oil drives returns for the US energy sector.
The blue line on this chart represents the SPDR Energy Index (NYSE: XLE) ETF while the orange line shows the relative strength of XLE to the S&P 500. As you can see, energy stocks entered a powerful bull market in both absolute and relative terms coming off the COVID lockdown commodity collapse in 2020.
Since early 2023, energy stocks have been treading water in a trading range. However, since the broader market rallied that’s resulted in deteriorating relative strength to the S&P 500. Despite the recent pop higher in oil prices amid geopolitical headlines and the big jump in natural gas, XLE is up just 3.6% year-to-date outperforming the S&P 500 by roughly 1.4 percentage points.
Extreme bearish sentiment on oil means that investors are still underweight energy stocks relative to other sectors of the S&P 500, a bias that’s likely to become increasingly uncomfortable as we move through the balance of 2025. According to the June Bank of America Global Fund Managers Survey, investors surveyed are almost 2 standard deviations underweight energy relative to 20 years of survey history.
Granted, the BofA survey was completed in the week of June 6 to June 12th, just ahead of last week’s surge in oil following Israeli airstrikes targeting Iranian nuclear facilities. So, it’s certainly possible global asset managers have ben reallocation capital to the group since that time. However, the S&P 500 Energy Index is only up about 1.7% since the close on June 12th, hardly the footprint of a major asset reallocation in favor of the sector. Certainly, that’s a good deal less than the 10% pop we’ve seen in crude oil prices over a similar time frame.
I’ve written about oil on multiple occasions in recent weeks, so I won’t bore readers with a lengthy discussion of the fundamentals this week. Suffice it to say that markets have thrown just about every possible bearish headline at oil this year – rising threat of recession amid a trade war, OPEC’s decision to increase production at a far faster pace than expected and forecasts for a surge in non-OPEC production from groups like the International Energy Agency.
Yet, despite the steady drumbeat of depressing headlines, West Texas Intermediate (WTI) was unable to sustain a breakdown below longstanding technical support at $65/bbl. And WTI broke back above $65/bbl BEFORE the recent geopolitical headlines hit the tape.
Meanwhile, despite all the talk of a global glut of oil caused by a surge in non-OPEC production and the loss of OPEC production discipline, there’s no evidence of that. Indeed, global commercial oil inventories are holding near 5-year seasonal lows while refining stocks have led the group higher, typically a signal of improving global demand.
The bearish narrative for natural gas was smashed late last year, sending related stocks sharply higher into 2025.
And the bearish narrative for oil, apparently all the rage with global asset managers, looks headed for the woodchipper right now; accordingly, I’m looking for a major asset reallocation favoring oil and energy stocks into the back half of this year.
Of course, I already recommend some exposure to energy stocks in the model portfolio – both oil and gas. However, I’m looking for an opportunity to further boost that allocation this summer. The only thing that’s staying my hand on that move this week is, ironically, the geopolitical hype swirling around this market.
And that brings me to this:
Oil: Fade Geopolitics
News of Israel’s strikes targeting Iranian nuclear sites late last week prompted a massive overnight spike in oil prices.
I’m often asked about action like this in oil. After all, most traders and investors have probably heard the so-called experts and talking heads in the mainstream media claim that geopolitics drive oil prices. Or perhaps you’ve heard comments like “oil is one headline away from $100/bbl,” or attempts to quantify the “geopolitical risk premium” in crude oil prices.
Usually, statements about the geopolitics of oil are followed up with commentary by some sort of military or political “expert” regarding the location of key Iranian oil infrastructure or the potential for the conflict to disrupt the flow of tankers through the Strait of Hormuz.
I must warn you:
Geopolitical headlines do NOT drive longer term trends in oil prices.
In my experience, traders and investors usually lose money trying to chase headlines or through efforts to weigh geopolitical risks, narratives and scenarios.
The truth is that crude oil prices are driven by supply and demand.
Listen, I know that’s not as exciting or scary as a map showing the location of oil infrastructure and military targets in Iran, but it’s the truth.
Just remember, the mainstream news media – even the financial media – is just a form of entertainment. If they can’t attract attention or eyeballs to their broadcasts, ratings go down and the advertising dollars and/or subscription revenues they depend on would follow suit.
And nothing attracts attention more than emotion (particularly fear).
However, to be a successful investor or trader you need to be able to separate emotions from your decision-making process as much as possible.
The CRUCIAL Question
The first question I ask myself when I hear geopolitical news likely to cause a spike in oil prices isn’t whether news or events will have a fundamental impact on the supply and demand balance for the oil markets.
The question I ask is this:
What was the trend in oil prior to the news?
Simply put, if oil prices were in a downtrend prior to the news and if the fundamental supply/demand balance was loosening (bearish fundamentals) then geopolitical events are an outright sell.
A classic example of this is September 2019:
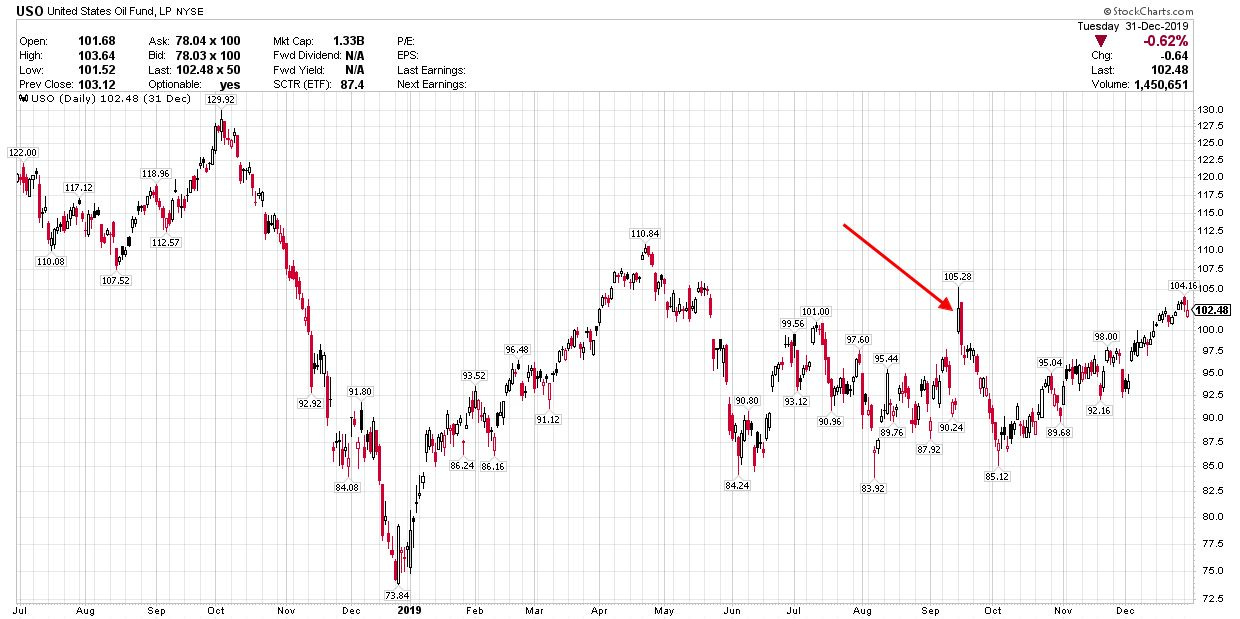
Source: Chart Courtesy of StockCharts.com
This is a chart of the US Oil Fund (NYSE: USO), an ETF tracking oil prices, from the middle of 2018 through the end of 2019. I’ve drawn an arrow showing the price action on Monday September 16th, 2019.
This was the first day of trading for oil, and the USO ETF, following a series of drone attacks on oil processing facilities at Abqaiq in Saudi Arabia. These attacks DID cause a significant impact on production from the world’s most important oil exporter – Saudi output fell almost 6 million bbl/day for a short period of time following the attacks.
Yet, I’d note two crucial points.
First, oil prices peaked in late 2018, collapsed into early 2019 and then entered a trading range for several weeks leading up the September 2019 drone attacks.
Fundamental balances in the oil market remained loose at that time and there were some concerns about softening demand.
In this scenario, the spike to the top of this range following the attacks was a golden shorting opportunity. Indeed, it’s one we took advantage of in one of the trading services I managed at that time.
Here’s a second, older example:
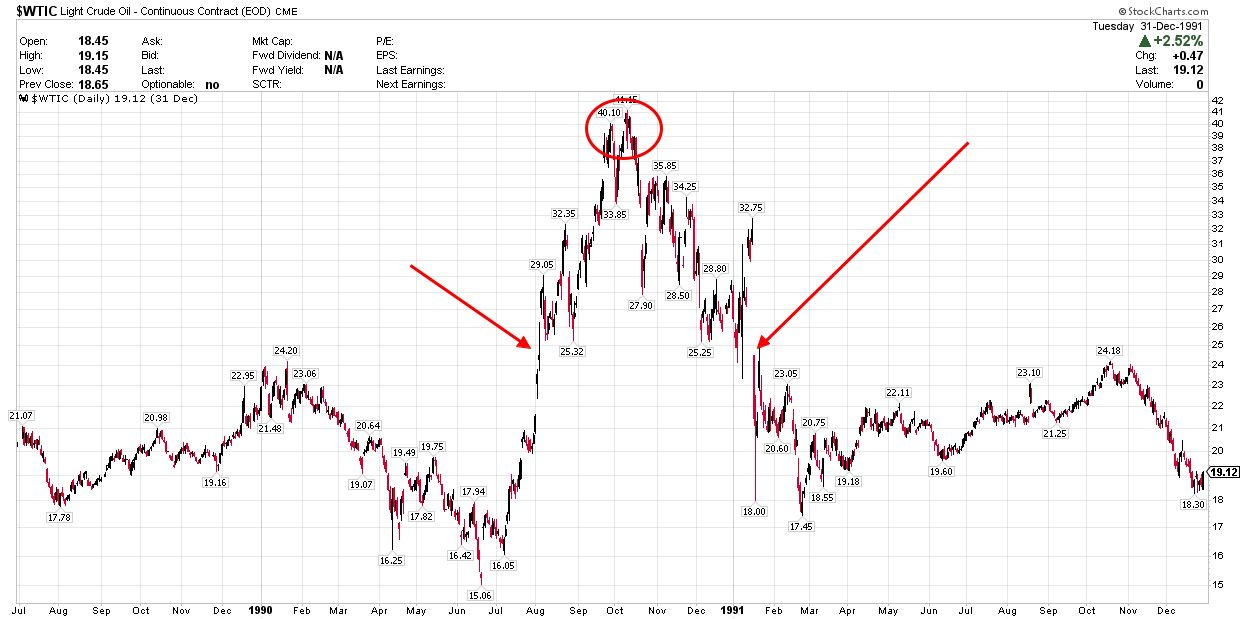
Source: Chart Courtesy of StockCharts.com
This chart shows West Texas Intermediate (WTI) oil prices from mid-1989 through the end of 1991.
To be fair, this geopolitical spike persisted for longer than most because it involved most of the world’s largest producers in the Persian Gulf region – Iraq, Kuwait and Saudi Arabia. However, the first red arrow on my chart represents trading in crude oil around the time of Saddam Hussein’s invasion of Kuwait in August 1990.
The circle on my chart represents a period when the US, the UK and coalition partners were building a significant troop presence in Saudi Arabia.
And, finally, the second red arrow marks the start of the US-led Operation Desert Storm to expel Iraqi forces from Kuwait. Desert Storm started with aerial bombardment of Iraq in January 1991 followed by a ground offensive in late February.
What’s interesting here is that the August/September 1990 spike in oil started to fade in mid-October, about three months before the start of Operation Desert Storm.
I must admit I wasn’t trading oil futures in early 1991.
(If memory serves, I was studying for my midterm exams in high school.)
However, in January 1991, oil was indicated sharply higher after hours on news of the launch of a massive aerial bombardment of Iraq but then opened sharply lower the following morning. Within days, crude was trading below $18/bbl, back near the 1989-90 lows.
Again, much like 2019, the fundamental and technical picture was bearish for crude leading up to the 1990-91 Persian Gulf War. So, despite the fact there was real damage to critical energy infrastructure in three of the world’s biggest producers, the entire spike in oil persisted for less than two months from early August to early October.
The second possibility is that oil is in an uptrend, and fundamentals are improving, leading up to geopolitical news.
In this case, political headlines will tend to cause a temporary acceleration of the uptrend followed by a fade and then continuation of the underlying trend.
An example is the 2022 Russian invasion of Ukraine.
Go back to my chart of USO above and you’ll see that oil was in a steady uptrend leading up to the actual invasion of Ukraine. Indeed, the uptrend in oil started back in 2020, long, long before the conflict for reasons that had little or nothing to do with Russia.
So, as I’ve labeled on my chart above, oil prices spiked following Russia’s invasion on February 24, 2022. However, by early March of the same year, just days later, oil was retesting its pre-invasion trading range.
The fade of that initial spike higher was a golden opportunity to buy oil as crude proceeded to trade higher into the summer months.
As I said, the market has thrown every possible bone to the oil bears it could this spring – talk of weak Chinese demand, the rising threat of a recession sparked by tariffs and, of course, a series of super-sized output increases from OPEC on three consecutive months.
And while oil got hit hard in early April, falling to the mid-$50’s/bbl the bears just couldn’t follow through and by late May/early June oil was already climbing back into its erstwhile trading range.
In my view, the global oil market was healing leading up to the recent geopolitical headlines and what you’re seeing right now is simply an acceleration of the recent, albeit nascent, uptrend.
In my view, oil and energy stocks could pull back with oil later this month as the geopolitical “spike” fades. However, I believe underweight fund managers will use the dips in energy as an opportunity to buy – I’m assembling a list of energy names to add to the portfolio via issues or flash alerts later this month.
Ultimately strength in oil is unlikely to be the result of any widescale disruption of the flow of oil from Iran or other producers in the region.
Rather, it’ll be the result of the market’s ongoing realization the supply/demand balance in the oil market is tighter – a LOT tighter—than groups like the International Energy Agency (IEA) were projecting at the start of the year.
With these points in mind, here’s a rundown of the changes and additions I’m making to the model portfolio this week:
Keep reading with a 7-day free trial
Subscribe to The Free Market Speculator to keep reading this post and get 7 days of free access to the full post archives.