


Uranium's Third Supercycle
The three key requirements for a nation's energy mix

Editor’s Note: This week, I’m publishing an excerpt from an article I wrote on FMS sister publication Energy & Income Advisor, an energy-focused service I co-founded 11 years ago with Roger Conrad of Dividends with Roger Conrad. Please enjoy.
—EG
Go to X (formerly known as Twitter), or simply follow any mainstream media outlet, and you’ll find plenty of energy activists.
Renewable energy maximalists advocating a rapid global transition to energy technologies like solar and wind, as well as talking heads claiming we need to ban the use of the internal consumption engine (ICE) or phase out all coal plants in the world within the decade.
However, our view is, and always has been, the entire energy “maximalist” view is dangerous for the simple reason there’s no single, perfect solution to the world’s energy needs.
While energy stocks may comprise less than 4.5% of the S&P 500, we’d argue energy is the lifeblood of the global economy with growth and energy consumption irrevocably correlated.
A recent article on Bloomberg, “Germany to Use Lowest Amount of Energy on Record This Year,” revealed German primary energy consumption – energy for electricity, transportation, heat and all other uses – is projected to decline 8% in 2023, to the lowest levels on record dating back to 1990. Indeed, German energy consumption in 2023 is expected to be 28% below where it was 33 years ago.
It’s shocking some have concluded this is a good thing, a sign of the country’s success in energy conservation, or efforts to reduce reliance on fossil fuel imports and carbon dioxide emissions.
The reality is far different:
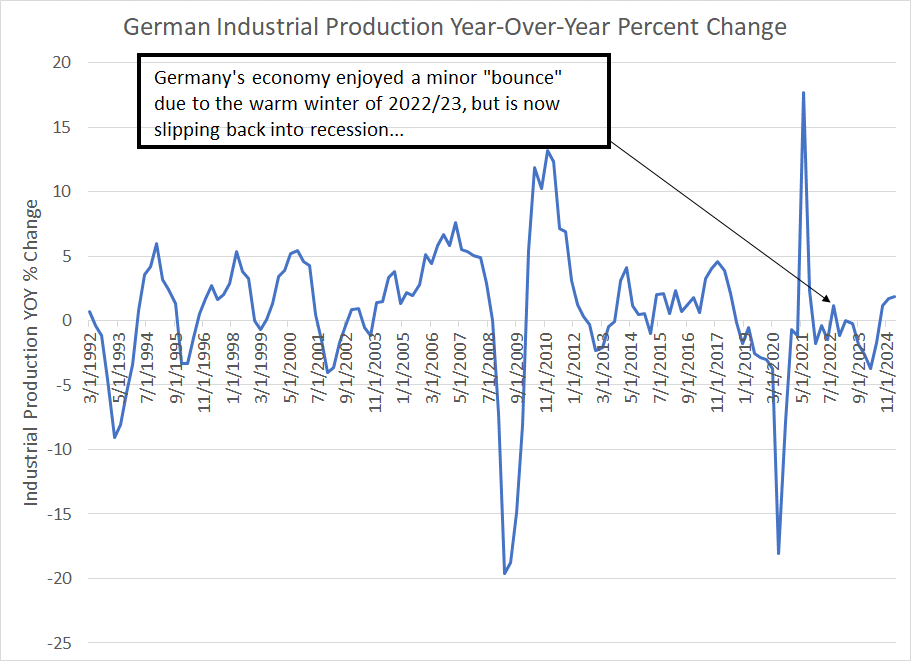
Source: Bloomberg
This chart shows the year-over-year change in Germany’s Industrial Production (IP), a good proxy for economic health in a country long-renowned for its manufacturing expertise. We’ve also included consensus forecasts from economists through the first quarter of 2025.
As you can see, German IP began shrinking in the fourth quarter of 2021, enjoying only a brief bounce in the third quarter of 2022. That “bounce” was largely a function of a warmer-than-average winter in 2022 and early 2023, which temporarily eased the region’s energy supply crisis sparked by Russia’s invasion of Ukraine.
In the third quarter of this year, however, German industrial production shrank more than 1.8% year-over-year, a decline that’s expected to worsen to -3.7% year-over-year into the first quarter of 2024. The only periods in the last 33 years where German IP has been weaker are the short-lived COVID lockdown crash in 2020, the Global Financial Crisis years of 2007-09 and the post-reunification slump in the early 1990s. Those are uncomfortable comparisons.
In short, the German economy entered recession in 2020 amid COVID lockdowns, entered recession again in 2022 amid an energy crisis and looks to be in recession yet again as of the end of this year, a double-dip (arguably triple-dip) downturn that’s largely a result of the region’s energy crisis.
While the economic consensus (optimistically) pencils in a bounce in industrial production into early 2025, the reality is the German economy will shrink in 2023 and is expected to grow at a 0.5% real annual pace in 2024 and 1.5% in 2025.
Many have now dubbed Germany the “sick man of Europe,” an unfortunate moniker the country hasn’t held since the post-reunification slump of the early 1990s.
The equation is simple:
When an economy grows, so does energy demand.
More broadly, the German experience should be a cautionary tale for investors. A nation’s energy mix must fulfill 3 basic requirements:
Affordable and Reliable – The German experience underlines that consistent economic growth requires affordable and reliable energy supply.
Energy Security -- Excess dependence on imported fuels, particularly from a single supplier, is dangerous. That’s why the Russian invasion of Ukraine, and the resulting loss of natural gas supply, quickly hobbled the European economy and has frustrated efforts to target Russia with economic sanctions.
Environmentally Friendly – Right now, the world’s focus is on carbon emissions; however, particulate pollution from diesel engines, as well as air and water pollution, are major issues particularly in emerging markets like China and India.
We’d argue the way – the ONLY way – to meet some acceptable combination of these three basic goals is through a diversified mix of energy sources including renewables, natural gas and nuclear power.
Advantage Nuclear
The most obvious advantage for nuclear power is the flip side of a major disadvantage of most renewable and alternative energy technologies.
Take a look:

Source: Energy Information Administration, Electricity Supply Monthly
This chart shows capacity factors for US utility scale generation facilities broken down by month from January 2021 through August 2023, the latest month for which we have data.
Capacity factors measure electricity generation from the referenced type of power plant as a percentage of the maximum theoretical capacity if all plants were operating continuously.
As you can see, the average monthly capacity factor for the US fleet of nuclear reactors over this time is a whopping 93.0% compared to 34.9% for the nation’s wind turbines and 24.6% for solar photovoltaic.
In other words, both solar and wind are intermittent sources of power dependent on atmospheric conditions.
The Rule of 8 and Storage Costs
For wind, just remember the “Rule of 8.” Most wind turbines are designed to generate optimal power output at an average wind velocity of 30 to 55 miles per hour. However, power output is exponentially related to the velocity of the wind such that if the average wind velocity drops by half, the power output from a turbine drops by a factor of 8.
In other words, if wind velocity halves, the output from a wind turbine declines by 87.5%!
Clearly, solar power doesn’t produce any power at night. On cloudy days, solar facilities will still produce some power; however, capacity can range from just 10% to 25% of the rated maximum depending on the degree of cloud cover and the efficiency of the solar panels.
Predicting the weather is tough even under the best of circumstances and the amount of power generated and fed into the electric grid must equal demand for electricity or the grid itself can destabilize, leading to widespread power outages. Thus, to balance the grid, solar and wind must be either supplemented by “shadow capacity,” such as natural gas turbines that can be fired up quickly to feed power into the grid or some sort of storage solution.
In contrast, of course, nuclear capacity is steady over time and doesn’t depend on the weather, when the capacity factor falls it’s usually due to refueling or scheduled maintenance.
And that brings us to this:
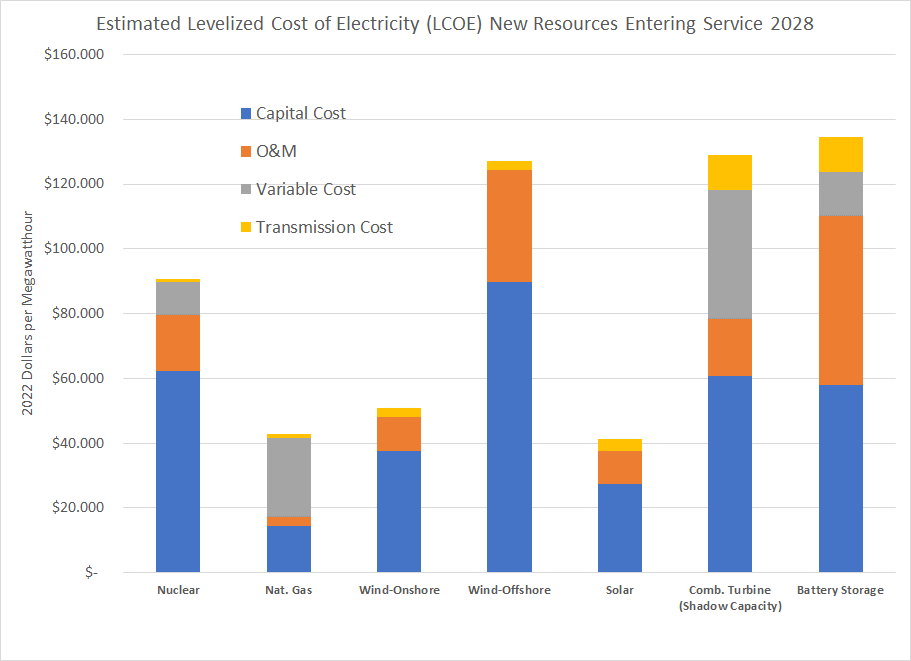
Source: Energy Information Administration Annual Energy Outlook
We’ve written before about the problems inherent in calculating the Levelized Cost of Electricity (LCOE) and how different organizations calculate cost estimates that vary widely. These costs depend on factors as varied and unpredictable as interest rates, commodity prices and politics.
However, here are the estimates in the Energy Information Administration’s Annual Energy Outlook for 2023 based on expectations for the cost of new capacity coming online in 2028.
Note these figures are before tax credits – these are the raw, unsubsidized prices. Cost factors include capital costs (borrowing money and building a plant), operating and maintenance costs (O&M), variable costs (fuel costs) and transmission costs (integrating each source with the grid).
A quick glance here shows onshore wind and solar look cheap with LCOEs of $50.87/MWh and $41.22/MWh compared to $90.80/MWh for nuclear. Both onshore wind and solar are competitive with combined cycle natural gas even before significant tax credits afforded to renewable energy technologies.
However, the problem remains the same as we just outlined -- the inherent intermittent generation from solar and wind. There are really only two ways to offset low capacity factors for solar and wind facilities and these are summarized in the final two columns on my chart.
The first is a combustion natural gas turbine or peaking plant that can be fired up quickly to feed power to the grid – this is shadow capacity and it’s the most common solution. Such plants are far less efficient than modern combined cycle gas turbines with an LCOE of $128.82/MWh.
The second is battery storage, where grid-scale storage remains a technology in its infancy. It’s also extremely expensive with an estimated LCOE of $134.63/MWh; even after $17.36 in tax credits, the cost of using battery storage to integrate renewables into the grid is sky-high.
Over time, the cost of battery technology will likely come down, rendering storage a more economic solution. However, batteries still require significant commodity/raw material inputs; rising commodity prices could offset efficiency and technological gains. Further, the degree of cost reduction needed is so great it’s likely to be a process that takes many years (possibly decades) to accomplish.
The good news is that rather than focusing on solar/wind or nuclear in isolation, the “all of the above” solution works best:
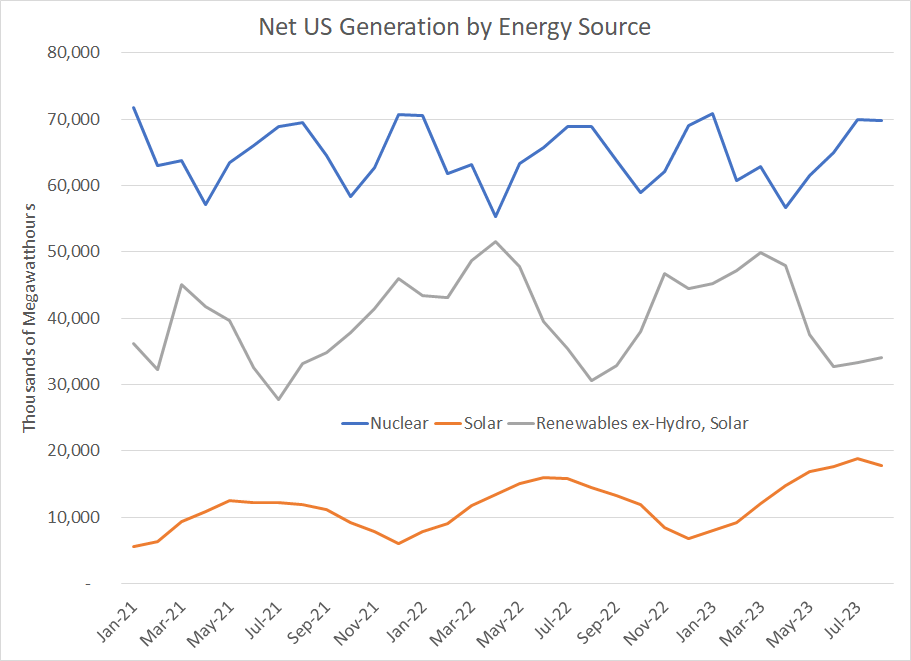
Source: Energy Information Administration
This chart shows net generation nationwide by month for three different energy sources – nuclear (blue), solar (orange) and renewables excluding hydroelectric and solar (grey). As you can see, nuclear provides a steady baseline of power output that’s particularly valuable when renewables output slumps.
For example, look at July 2021 and August 2022, both months where renewables output was weak overall; strong output from nuclear helped balance those lulls. And, of course, nuclear provides that power with no emissions of carbon dioxide, nitrous oxide, mercury, sulfur or particulates.
One more chart:

Source: European Commission, Energy Information Administration
Regardless of the veracity of the Energy Information Administration’s LCOE estimates we just outlined, this chart shows where the proverbial rubber meets the road – the residential cost of power on a per KWh basis.
In Germany, which recently retired its last commercial nuclear reactor, the cost of power for residential consumers approached US $0.45/KWh in the first half of this year compared to $0.25/KWh in France, where nuclear comprises approximately 70% of electricity generation.
The US average price of electricity was just shy of $0.16 for residential consumers in August 2023. California, which derives about 8% of its in-State electricity generation from nuclear pays almost $0.30/KWh compared to South Carolina, where nuclear has a 56% share, and the residential price of power stands at less than $0.14/KWh.
It's no coincidence there’s a correlation between electricity costs and nuclear technology.
In short, we believe nuclear power has a prominent role to play in delivering affordable, emissions-free energy. It’s not the only solution, but it’s clearly a crucial part of the mix.
Growth and Uranium’s Third Bull Market
The first experimental nuclear reactor started up back in 1951 in Idaho with actual commercial nuclear power production following by the late 1950s.
The 1970s then marked the first major bull market in uranium prices as countries around the world began to rapidly expand nuclear output as a response to the OPEC oil embargos and energy shortages of that era.
Take a look:
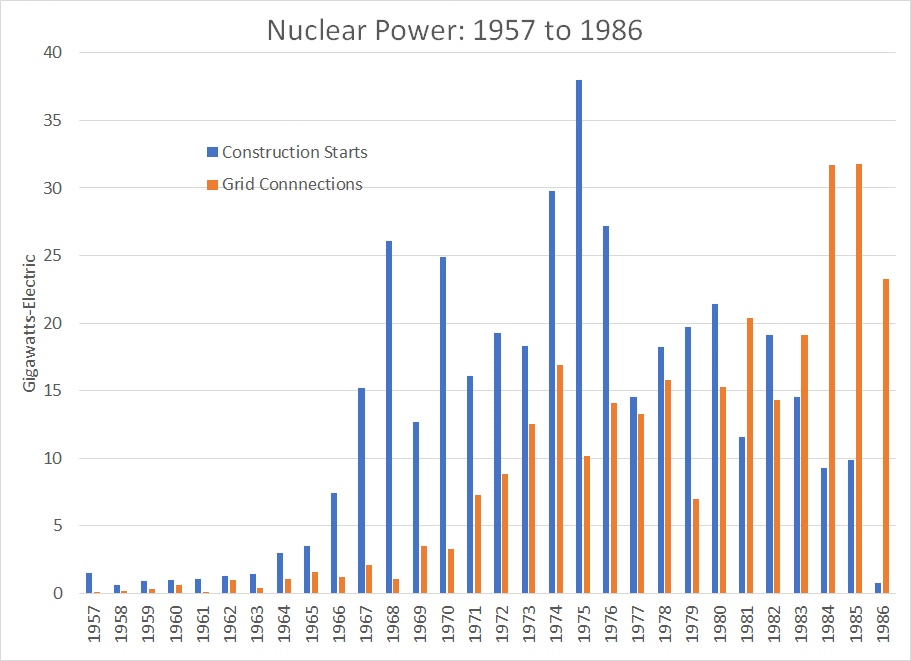
Source: International Atomic Energy Agency “Nuclear Power Development: History and Outlook,” 1987
This chart shows total nuclear reactor construction, measured in Gigawatts as well as the total capacity of reactors connected to the grid, for every year from 1957 to 1986.
As you can see, global reactor construction was nominal until the mid-to late 1960s and then remained strong through to the early 1980s (blue bars). Since it takes time for a reactor to be constructed and connected to the grid, you can see the boom in reactor construction resulted in a rapid increase in new nuclear grid connections starting in 1972-73. That increase in nuclear capacity continued through to the mid to late-1980s.
Between 1970 and 1981 global nuclear power generation rose more than ten-fold and between 1981 and 1991 it more than doubled again.
Simply put, growth in global reactor capacity outpaced uranium supply through the 1970s, so prices for the key nuclear fuel had to rise to levels that incentivized additional mine production.
The result: A more than 500% increase in the price of uranium over the decade of the 1970s.
The partial meltdown of the Three Mile Island nuclear facility in Pennsylvania in 1979 and the Chernobyl accident in Soviet Ukraine in 1986 cooled interest in nuclear power in the 1980s though construction and generation capacity continued to grow. Moreover, subsequent studies indicated no measurable health effects from the partial meltdown at Three Mile Island while the Chernobyl accident was more a function of a (known) faulty Soviet reactor design, and human error, than any inherent safety concerns with nuclear.
Longer term, the more important driver of the bear market in uranium prices starting in the early 1980s was likely the lagged effect of investments made in new supply amid the boom years of the 1970s. This was, in essence, the same pattern we saw in oil markets through the 1970s and 1980s – soaring prices in the 1970s led to increased spending on exploration and the start-up of significant non-OPEC supply from the late 1970s to early 1980s.
The second big uranium bull market kicked off in 2000 when spot uranium prices hovered just over $7 per pound, rising more than 18-fold to $136/pound at the peak in 2007.
Once again, there were both supply and demand drivers to the bull market in the early 2000’s.
On the demand front, China embarked on a massive construction boom in this era:

Source: Energy Institute, Statistical Review of World Energy 2023
This chart shows total nuclear power generation from 1993 through 2022 for all countries outside the Organization for Economic Cooperation and Development (OECD), a proxy for emerging markets. I’ve also broken out China’s contribution to total non-OECD nuclear generation.
As you can see, China’s nuclear generation soared almost tenfold from 2001 to 2015 alone; the country now accounts for almost 16% of total global nuclear power generation, up from about 0.6% in 2000.
On the supply front, there were a few issues in this era.
First, after years of depressed prices, there was little interest in opening new uranium mines or expanding production capacity. Thus, the industry was ill-prepared to handle the rapid expansion in nuclear capacity in emerging markets like China, an echo of the 1970’s experience in the developed world.
In addition, Canadian giant Cameco reported in 2003 that its massive McArthur River mine in northern Saskatchewan had flooded. At the time, the project was the largest in the world in large part due to the fact the region has some of the highest grades of ore in the world. Cameco was mining rock that averaged 21% uranium, meaning it had to move and process far less material to extract uranium than most other producers in the world where ore grades were typically under 5% at that time.
Following that 2003 incident, flooding continued to plague Cameco for much of the next 5 years amid additional incidents at McArthur River and the nearby Cigar Lake mine.
The result was loss of uranium supply. In 2006, for example, the OECD reported global uranium production at about 39,603 tonnes, down 5.6% from 2005 despite the rise in uranium prices. Meanwhile, global demand for uranium in the same year stood at 66,500 tonnes, meaning global mine production covered less than 60% of global demand, forcing reliance on secondary sources such as reprocessed Russian nuclear warheads and commercial stockpiles.
That supply-demand crunch catalyzed both a surge in uranium prices and a 1,745% gain in Cameco’s stock between the end of 2000 and the middle of 2007.
Our view is the surge in uranium prices over the past few years represents the start of a third major bull market.
The main drivers of this bull market should be familiar given the history of the industry I just outlined since the 1960’s. First, and most important in our view, is years of depressed uranium prices in the wake of the early 2000’s boom-bust cycle have resulted in consistent underinvestment in new uranium production capacity.
Indeed, in July 2018, facing a weak uranium market, Cameco announced it would extend the suspension of production from its two massive Canadian mines, McArthur River and Key Lake, from a temporary 10-month idling process to an indefinite closure.
In the end, both mines remained closed for a duration of around 4 years; it wasn’t until February 2022 the company announced a plan to finally restart both operations amid an upturn in uranium demand and contracting activity from utilities interested in locking down new supply. Finally, on November 9th of last year – about one year ago – Cameco announced the first pounds of uranium from these mines had been milled.
Here's a look at the long-term picture for uranium supply and demand:
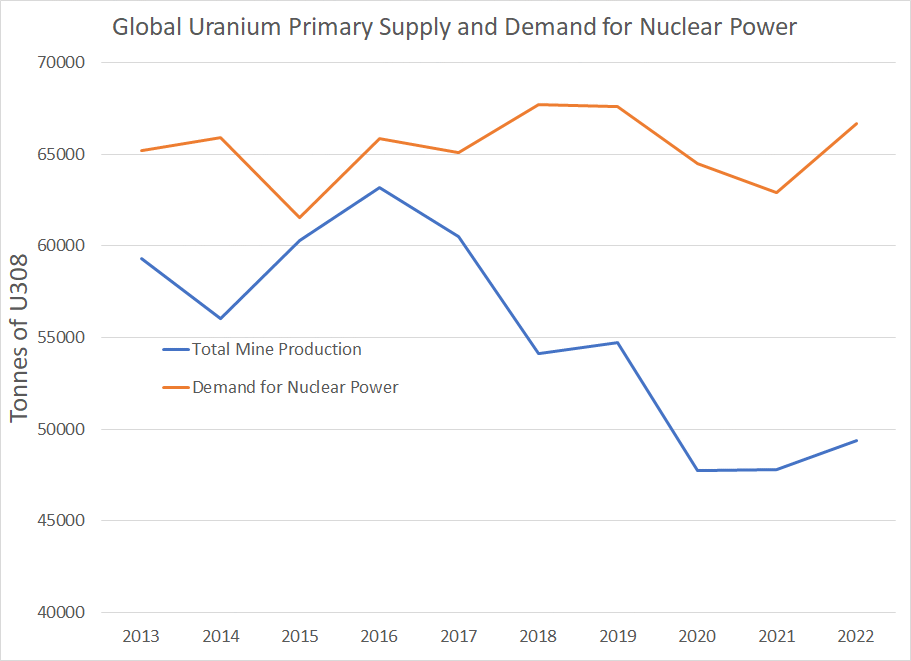
Source: World Nuclear Association (WNA)
This chart shows total global uranium demand for nuclear power plants from 2013 through 2022 along with total primary uranium production – that’s production from global uranium mines.
In 2022, production of uranium from global mines only met about 74% of global demand, so the balance had to be supplied from secondary sources including existing inventories of material.
And this is nothing new – there hasn’t been a single year since 2003 where uranium mine production has been adequate to meet global demand.
That’s unsustainable longer term, especially if WNA estimates that demand for uranium could rise as much as 28% by 2030 prove out. And those estimates look reasonable given new reactors already under construction coupled with restarts in Japan and license extensions elsewhere.
And estimates are that long-term uranium prices in the $60 to $70/pound range are sufficient to incentive restarts of operations at high-quality mines like McArthur River. However, prices need to be much higher -- $80 to $90 per pound – to generate real interest in opening new mine capacity.
DISCLAIMER: This article is not investment advice and represents the opinions of its author, Elliott Gue. The Free Market Speculator is NOT a securities broker/dealer or an investment advisor. You are responsible for your own investment decisions. All information contained in our newsletters and posts should be independently verified with the companies mentioned, and readers should always conduct their own research and due diligence and consider obtaining professional advice before making any investment decision.