

Valuations, Interest Rates and Breadth
Valuations, Interest Rates and Breadth
The troubling trend behind a key stock market anomaly this year...

This morning, the yield on the 10-Year US government bond hit an intraday peak of close to 4.75%, up 150 basis points from the April low.
That’s the highest yield on the 10-Year Treasury in 16 years.
Yet, as I write this post, the S&P 500 is up 13.1% year-to-date in 2023 and the Nasdaq 100 is up a whopping 36%. Meanwhile, just last year, the Fed’s aggressive rate hike campaign and the surge in Treasury yields were widely blamed for a slumping stock market.
The question, one I’ve received from multiple readers in recent days, goes something like this:
“Why did rising interest rates represent a powerful headwind for stocks in 2022, yet even higher yields in 2023 seem to be having little or no impact on equities?”
The Discount Rate
In theory, stock market valuations and interest rates should be related.
A company is worth the present value of all future cash flows. Since we can’t know what a company’s profits and cash flows will be next quarter, let alone 5 or 10 years in future, stocks are generally valued on expectations for future cash flows and earnings.
And, as most investors are all-too-keenly aware, market expectations for a particular company’s future growth outlook and profitability can change over time, sometimes dramatically.
Yet, even if we could quantify with a high degree of certainty, how much a company will earn years into the future, that leaves the issue of how we discount the value of those future earnings to account for the time value of money.
Simply put, we all know that $100 paid in 5 years’ time is worth less than $100 in your pocket right now; the question is how much less.
One of the most important factors in determining the time value of money is the risk-free rate of interest – the amount of return an investor could expect from owning a safe asset like a government bond. In short, when US government bond yields are rising, we’d expect the discount rate applied to future earnings and cash flows to rise as well, depressing the present value of future earnings and, by extension, stock market valuation multiples.
Logically we’d expect “growth” stocks that depend on expectations for distant future earnings to support current valuations, to be more sensitive to rising discount rates than “value” stocks that have a higher level of current profits.
It’s crucial to make a distinction between prevailing stock market valuations and market performance.
Remember when interest rates are rising, pushing discount rates higher, that does NOT mean the stock market is falling outright.
Historically, when rates and government bond yields are rising, it’s usually because the economy is strengthening, which would be expected to result in stronger economy-wide earnings growth. That’s why the stock market has historically performed better when government bond yields are rising than when they’re falling.
Simply put, stronger earnings growth can BOTH push up the S&P 500 and drive down market valuations; when earnings rise, it pushes up the denominator of the price-to-earnings (P/E) ratio, making the market “cheaper” on this basis.
From Theory to Practice
So, let’s examine the relationship between S&P 500 market valuations and yields on the 10-Year US government bond:

Source: Bloomberg
This chart shows the 10-Year Treasury Yield on the x-axis (horizontal axis) plotted with the forward P/E ratio of the S&P 500 on the vertical y-axis. I’ve also plotted a linear trendline and the R-squared value of this regression. This particular chart uses daily data from December 31, 2009 through December 31, 2021.
There’s a negative relationship here; as theory would suggest, rising 10-Year Treasury yields tend to correspond to lower stock market valuations.
The R-squared value of 0.31 suggests the level of 10-year Treasury yields explains about 31% of stock market valuations; clearly, there are multiple other factors that go into determining broader market valuations than prevailing bond yields. However, R-squared ratios for regressions on financial market and economic variables are notoriously low and an R-squared of 0.31 is high enough to give this “model” some practical utility.
Let’s look at the same regression for daily data in 2022:
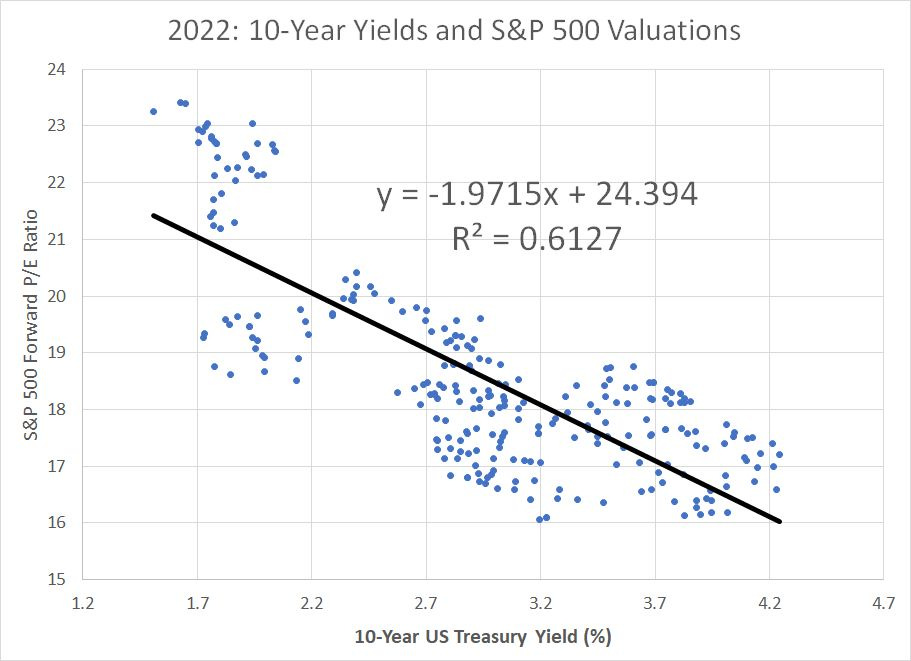
Source: Bloomberg
Same story here: There’s a clear inverse relationship between the level of 10-Year Yields and the 12-month blended forward price-to-earnings ratio for the S&P 500. What’s more the R-squared for last year is 61.3%, almost twice that of the end-2009 to end-2021 period covered by my first chart.
This probably isn’t a huge surprise given the stock market’s fascination with the Fed last year – it’s no secret the Fed’s decision to embark on the most aggressive tightening campaign since the early 1980s was a factor in driving down broader market valuations.
And that brings me to 2023:
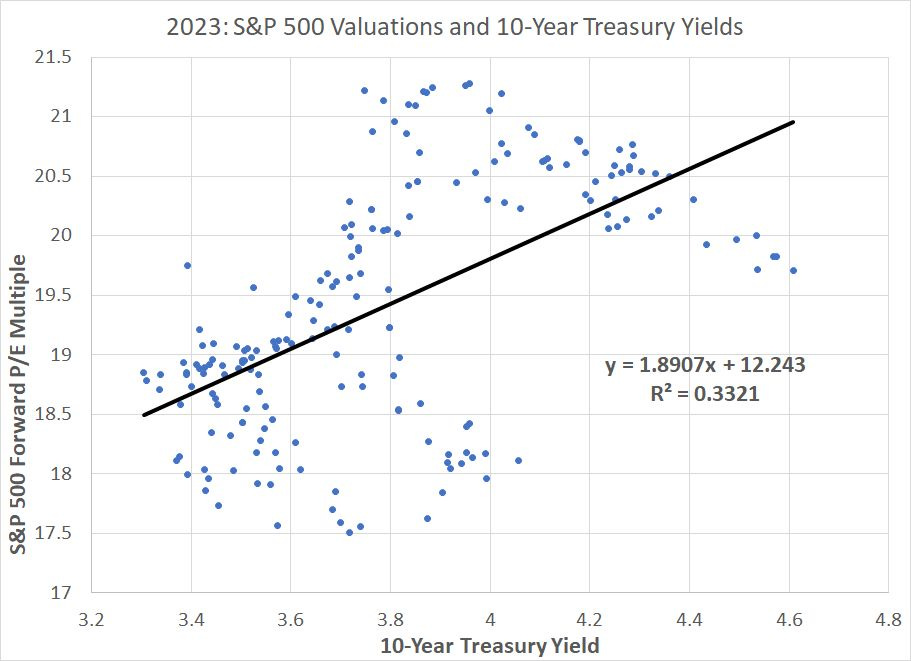
Source: Bloomberg
I’ve plotted this chart in the same manner, and you can see there’s a clear break in the relationship here. The slope is now positive, meaning that so far this year rising Treasury yields have tended to result in HIGHER stock market valuations.
What’s more the R-squared value of this regression is 0.33, implying a reasonably strong fit to the data.
The 2023 Anomaly
So, the question is why did rising bond yields have such a negative impact on market valuations last year while having the opposite impact on market valuations in 2023?
Well, lets dig a bit deeper starting with this:
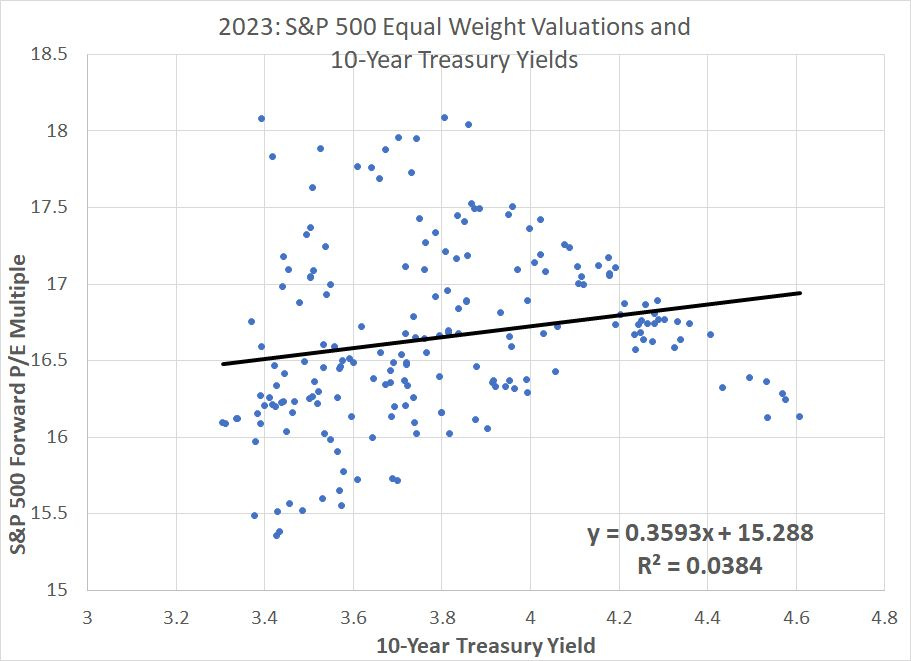
Source: Bloomberg
This chart shows the same regression except I’m regressing the 10-Year yield against the forward P/E ratio on the S&P 500 Equal-Weight Index rather than the more common market cap weighted version of the S&P 500.
As the name suggests, the S&P 500 EW weighs each component in the index equally rather than by market value, resulting in lower index weights for the mega-cap tech and tech-attached heavyweights that have come to dominate the S&P 500.
This represents a huge shift.
Granted, the slope of my trendline is still slightly positive, just as for the S&P 500, but the R-squared at 0.038 suggests a poor fit to the data.
In other words, the anomalous positive relationship between market valuations and yields on the 10-year Treasury largely evaporates when we use the S&P 500 Equal Weight Index.
Some 25 years ago while writing my graduate dissertation at the University of London, I was examining the relationship between various fundamental metrics and subsequent stock performance. At the time, my work primarily focused on the US and UK markets; my dissertation advisor suggested I try examining the same variables on other global markets to help ascertain the power of the relationships.
Let’s employ a similar “trick” here with Germany’s DAX stock market index:

Source: Bloomberg
This is the same scatterplot, except I’m comparing the forward P/E ratio on Germany’s DAX Index compared to the yield on 10-year German government bonds (10-year Bunds) in 2023.
As you can see, the anomalous relationship between yields and market valuations so apparent for the S&P 500 doesn’t apply to the German market – indeed, there’s a clear negative correlation between German market valuations and rates, much like what we’ve seen over longer time frames for the S&P 500.
Put these pieces together and we’re beginning to see the outlines of an answer to the question posed at the beginning of today’s post.
Simply put, rising Treasury yields remain a negative for stock market valuations with the important exception of the traditional market cap weighted version of the S&P 500.
As I’ve explained in recent issues, the S&P 500 has become increasingly levered to a handful of large cap technology and tech-enabled growth stocks including Microsoft (NSDQ: MSFT), Apple (NSDQ: AAPL), Amazon (NSDQ: AMZN) and NVIDIA (NSDQ: NVDA). These index heavyweights have, in turn, accounted for almost all of the gain in the S&P 500 year-to-date – the S&P 500 Equal Weight Index is up just 1.8% so far in 2023, underperforming the S&P 500 by more than 11 percentage points.
So, the anomalous relationship between S&P 500 valuations and Treasury yields through the first 9 months of 2023 appears to be a symptom of poor market breadth and a bubble in hot themes like artificial intelligence (AI).
Breadth is Deteriorating
In short, this valuation-yield “anomaly” is closely related to this crucial trend:
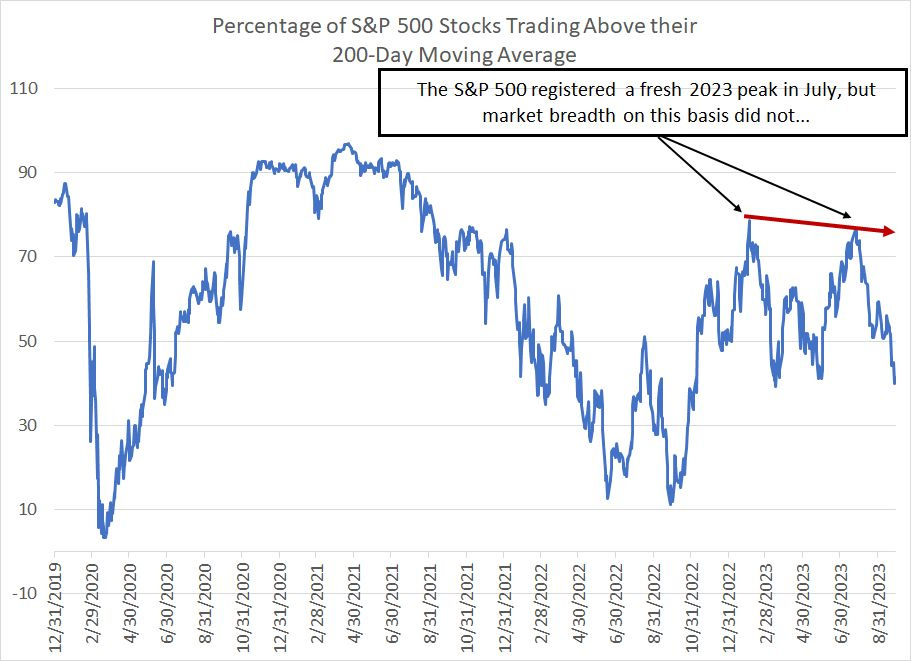
Source: Bloomberg
This chart shows the percentage of S&P 500 stocks trading above their respective 200-day moving averages. The 200-day simple moving average is a good long-term trend indicator and stocks trading above their 200-day can generally be considered in an uptrend.
For the S&P 500, the 200-day moving average stands at close to 4,200; while the index has fallen around 7% from its late-July peak, the S&P 500 continues to hold above its 200-day moving average. In fact, the S&P 500 hasn’t closed below its 200-day since mid-March.
However, as of the final trading day in Q3 only 40.8% of all stocks in the S&P 500 were trading above their respective 200-day moving averages. A few days earlier, on September 26th that percentage slipped below 40% for the first time in more than 6 months.
While the Index is less than 10% below its peak for the year, some 60% of all stocks in the S&P 500 are in downtrends on this basis.
What’s more, the S&P 500 hit its 2023 peak in late July; at those highs, the index was trading almost 10% higher than its February 2nd 2023 closing high. Yet, the percentage of S&P 500 stocks trading above their respective 200-day moving averages was lower in July than back in February – most stocks in the US aren’t fully participating in the broader market rally this year.
I must warn you, rallies on narrow breadth – dominated by just a handful of large cap stocks -- can continue for months and have a nasty habit of persisting far longer than the “crowd” expects. We’re entering a seasonally strong period for the stock market in the final quarter of the year and there’s a good chance we could see more upside into year-end.
However, make no mistake about it, the rally that started almost a year ago in October 2022, the rally that’s defied the Fed’s efforts to tighten policy and ignored the ongoing surge in inflationary pressures, is built on a foundation of sand. I believe it’s also fooling some pundits into believing the US economy is stronger than is the case.
And once the market valuation, interest rate and economic reckoning finally infects the handful of stocks buoying the S&P 500 this year, the downside could be breathtaking.
DISCLAIMER: This article is not investment advice and represents the opinions of its author, Elliott Gue. The Free Market Speculator is NOT a securities broker/dealer or an investment advisor. You are responsible for your own investment decisions. All information contained in our newsletters and posts should be independently verified with the companies mentioned, and readers should always conduct their own research and due diligence and consider obtaining professional advice before making any investment decision.