

Valuations May Surprise You
Valuations May Surprise You
Can tech leadership continue?

To say the calendar is busy for markets this week is an understatement.
On Wednesday, Treasury is set to release its quarterly refunding statement detailing the mix of Treasury Bills, Treasury Notes and Treasury Bonds it plans to issue in Q1 2024. The same afternoon at 2 PM Eastern Time, the FOMC will release its decision on interest rates followed, as usual, by a press conference hosted by Fed Chair Jerome Powell.
Thursday brings the ISM Manufacturing Index, one of the most widely watched leading indicators of US economic activity.
And on Friday February 2nd, the Bureau of Labor Statistics (BLS) will release the January Employment report as well as its annual benchmarking revisions.
On top of all that, lest we forget, 5 of the of the Magnificent 7 market leaders are due to report earnings this week:
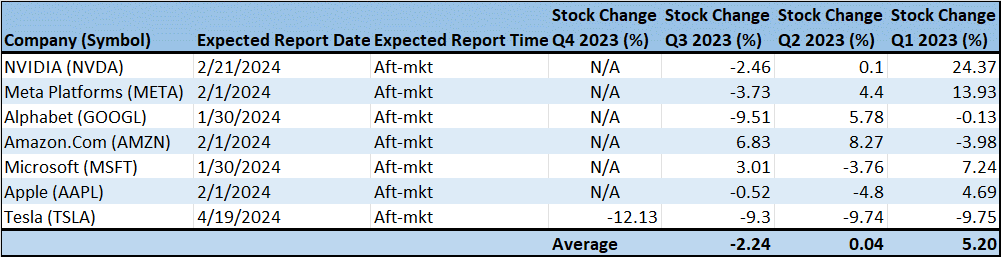
Source: Bloomberg
The list includes Alphabet, the parent of Google, and Microsoft due to report earnings after the close today followed by Apple, Amazon.Com and Meta Platforms, the company formerly known as Facebook, after the close on Thursday.
This avalanche of market-moving economic and corporate news poses some short-term risks for markets.
Take a quick glance at my table above and it’s clear the Magnificent 7 aren’t always so “magnificent” in the trading day following their quarterly earnings releases. Following Q3 results in late October and early November, for example, 5 of the 7 heavyweights saw losses in the trading day after results for an average decline of 2.24%.
Following Q2 2023 results, reported last summer, three of the Mag 7 saw losses in the day after their release – on average they were unchanged following earnings.
Meanwhile, the Nasdaq 100 is (very) overbought right now:
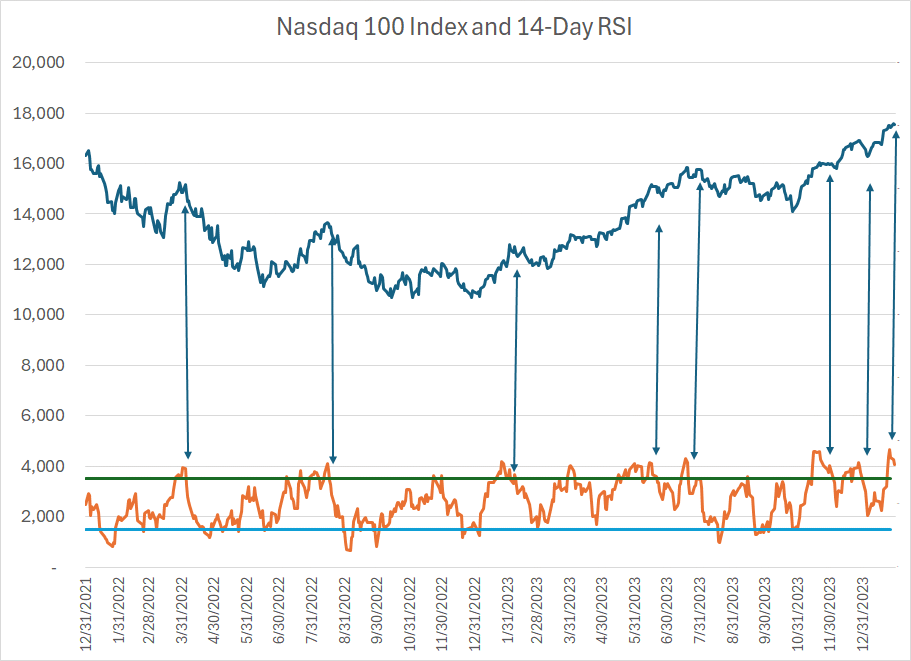
Source: Bloomberg
The 14-Day Relative Strength Index (RSI) is a measure of market momentum over a trailing 14-day period. I’ve plotted this indicator as an orange line on the lower edge of my the chart of the Nasdaq 100 above.
Generally, readings over 70 (the green line) are considered overbought while readings under 30 (the blue line) are oversold. As you can see, the recent runup in the Nasdaq took us deep into overbought territory to a sky-high reading of 93.23 on January 25th.
Now the 14-day RSI is NOT a long-term indicator. Generally, strong markets, and leadership groups like the Nasdaq 100, have a tendency to become overbought frequently – it’s the very definition of an uptrend.
However, as you can see in my chart above, extended RSI readings in the Nasdaq 100 over the past two years have tended to resolve with at least a brief pullback or market correction.
And with the Nasdaq 100 overbought just ahead of an avalanche of earnings and market-moving economic news, I believe the risk is elevated we see at least a modest bout of profit-taking over the next week or two.
And that brings us to the longer-term question regarding the Nasdaq 100 and the tech/growth heavy leadership groups that have dominated market returns since the start of 2023:
Is the Nasdaq 100 Expensive?
How about the Magnificent 7 group of growth and technology stocks, names like Amazon.com (NSDQ: AMZN), Apple (NSDQ: AAPL) and NVIDIA (NSDQ: NVDA) that have led the market higher in recent years?
Well, let’s start with the Nasdaq 100:
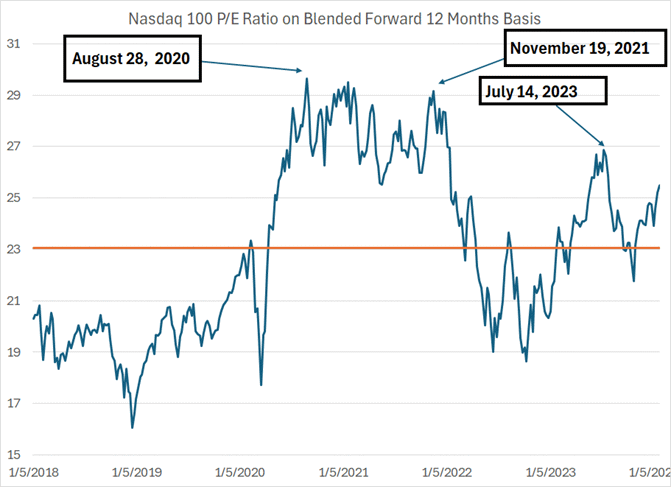
Source: Bloomberg
This chart shows the price-to-earnings ratio for the Nasdaq 100 based on blended forward 12 months earnings estimates.
The current ratio is 25.5 times while the average since early 2018 is about 23.1 times; so, on an absolute basis, the Nasdaq 100 is about 2.4 turns more expensive than the roughly 6-year average.
However, as you can see from my chart above, valuations for the Nasdaq 100 have been a story of before and after 2020 with a notable inflection higher since the COVID lockdown stimulus boom in the spring of 2020. Indeed, on average, the Nasdaq 100 has traded at a blended forward P/E of about 24.75 times since January 2020, meaning that the Nasdaq is trading pretty close to in-line with the average of the past 4 years.
Moreover, valuations remain far less stretched for the Nasdaq 100 today than was the case in November 2021 around the time the Nasdaq peaked before the 2022 bear market. In fact, the Nasdaq 100 is cheaper today than it was in July 2023, just before its roughly 11% correction from July through October of last year.
And here’s a quick look at relative valuations:
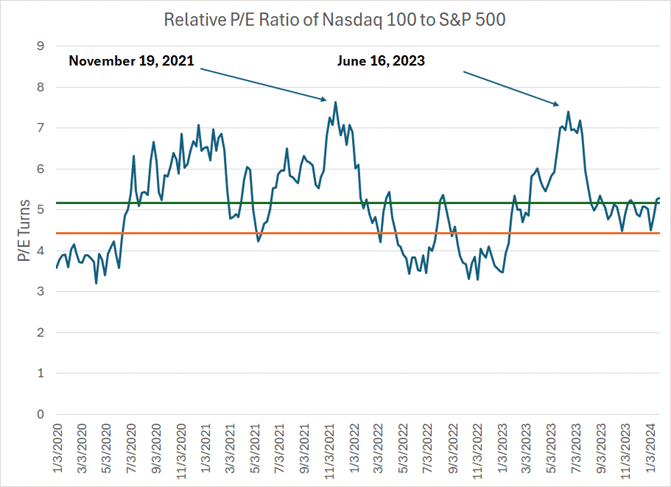
Source: Bloomberg
Currently, the S&P 500 trades at 20.2 times blended forward earnings estimates compared to the Nasdaq 100 at 25.5 times as I mentioned earlier; the Nasdaq 100’s premium to the S&P 500 is about 5.3 P/E turns.
The average since early 2018 (orange line on my chart) is 4.42 turns and the average since January 2020 is about 5.2 turns. So, the Nasdaq 100 is expensive relative to the S&P 500, but not by much compared to the post-COVID “normal” and, certainly, far below the peaks witnessed in November 2021 and in mid-July 2023, just prior to the July-October Nasdaq correction.
So, let’s look at the Magnificent 7 on the same basis:
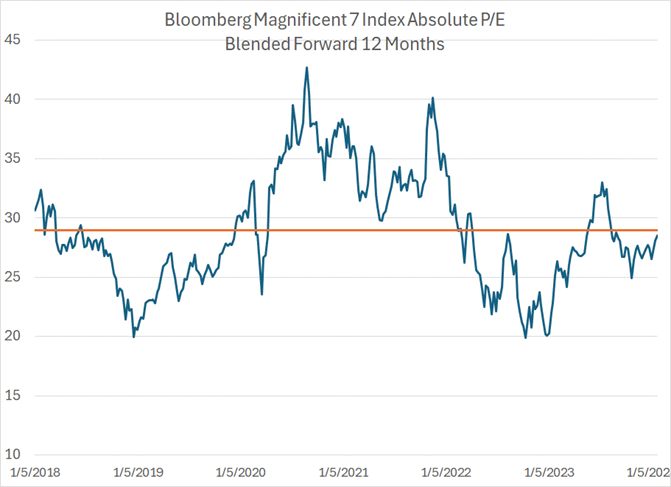
Source: Bloomberg
This chart shows the absolute Price-to-Earnings Ratio for the Bloomberg Magnificent 7 Index since early 2018 based on those same blended forward 12-month earnings estimates. As you can see, the Magnificent 7 trades at about 28.5 times forward earnings estimates compared to an average of about 29 times since 2018, so it’s actually a bit cheap on this basis.
Ironically, the Magnificent 7 looks cheaper still relative to the S&P 500:

Source: Bloomberg
This chart shows the forward P/E ratio for the Magnificent 7 relative to the S&P 500 since 2018. The average valuation premium since 2020 is 10.3 turns and since January 2020 it’s 10.7 turns compared to only about an 8.3 turn premium today.
The Island of Growth
Brass tacks: the Nasdaq 100, the Magnificent 7 and technology shares generally have been outperforming because they’re showing superior near-term growth.
Take a look:
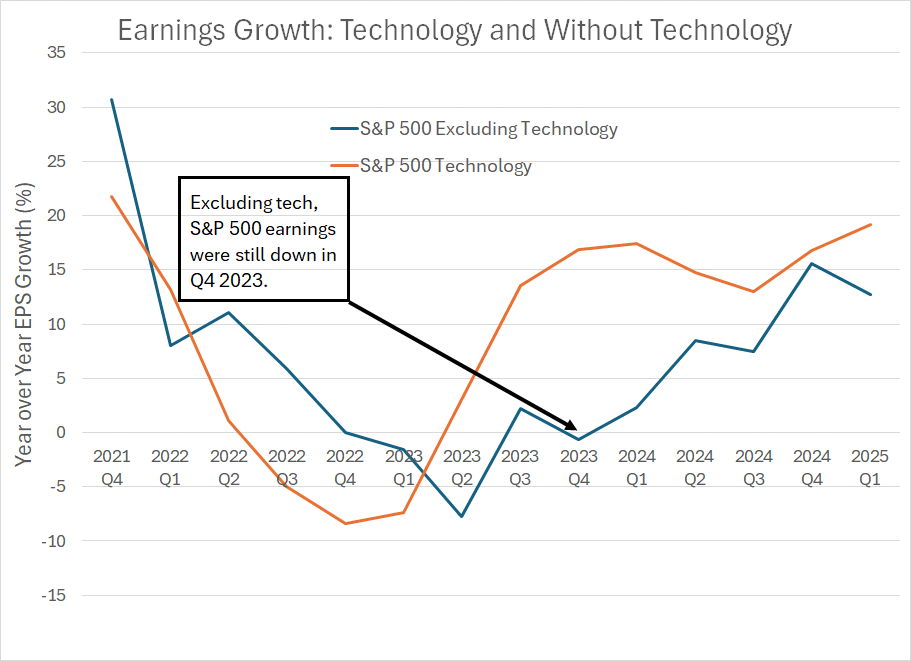
Source: Bloomberg
The blue line in this chart represents year-over-year earnings growth for the S&P 500 excluding the S&P 500 Technology Index since Q4 2021 with Wall Street consensus forecasts through the first quarter of 2025.
The orange line represents year-over-year earnings growth for the S&P 500 Information Technology Index.
Three points to note.
First, for Q4 2023 – that’s the quarterly reporting season underway right now – earnings for tech stocks in the S&P 500 are expected to show growth of about 16.8% year-over-year. If we exclude technology stocks from the index, S&P 500 earnings for the same quarter are expected to shrink slightly year-over-year.
Second, note that year-over-year growth for tech turned positive in Q2 2023, about 3 quarters before the projected end of the profit recession for the rest of the S&P 500 in Q1 2024 (the current calendar quarter).
Third, through the rest of the forecast period covered by my chart tech is expected to post earnings growth superior to the rest of the S&P 500.
Simply put, US technology stocks – alongside tech-enabled growth stocks like Amazon.com and Netflix – are the most visible growth stories in the US market right now.
In fact, given the S&P 500’s hefty weighting in tech, you could argue that the US technology and growth heavyweights are the most visible growth stories anywhere in the world. And, when there’s not much earnings growth to be found in equity markets around the world, companies that show consistent growth can be expected to attain premium valuations.
So, the bottom line is that while the Nasdaq 100 is overbought near-term and vulnerable to some profit-taking, it’s a bit early still to sound the death knell for tech stocks over the intermediate-term.
Certainly, you can make a compelling argument that tech and the Magnificent 7 look “cheap” relative to absolute and relative valuations over the past few years. And as islands of growth in an otherwise uninspiring earnings backdrop, US tech and growth shares can command a premium valuation.
Please don’t misunderstand me – I continue to believe the top- and growth-heavy market rally of the past 15 months will come to an end and, when it does, the situation could turn unpleasant fast. The situation bears some resemblance to the final push higher in the Nasdaq back in 1999-2000, or the go-go growth era of the 1960s. The ultimate resolution could also bear an unfortunate resemblance to the bear markets of the 1970s and 2000s.
However, calling an exact market top is an exercise in frustration and, given the shorter-term valuation and growth dynamics I just outlined, the tech and growth rally isn’t as illogical as it might first seem.
In my view there are two potential catalysts for the tech and growth rally to end, the same two catalysts that finally ended the long bull market in the same groups in the late 1990s:
A recession. While technology earnings are considered less cyclical and economy-sensitive than the S&P 500 as a whole, that’s not an entirely accurate assessment.
The experience in years like 2000-02 is that companies do cut technology CAPEX when there’s a full-blown recession.
Material earnings disappointments. Investors of a certain vintage will recall disappointment with then market-leader Cisco’s earnings in early 2000 helped catalyze the initial tech wreck that ultimately ended in an 80%+ decline in the Nasdaq to the 2002 lows.
Simply put, the earnings and growth “math” for the group I just outlined falls like a proverbial house of cards if the superior earnings growth outlook for a handful of large-cap tech stocks begins to fade.
DISCLAIMER: This article is not investment advice and represents the opinions of its author, Elliott Gue. The Free Market Speculator is NOT a securities broker/dealer or an investment advisor. You are responsible for your own investment decisions. All information contained in our newsletters and posts should be independently verified with the companies mentioned, and readers should always conduct their own research and due diligence and consider obtaining professional advice before making any investment decision.