

What Bear Market?
What Bear Market?
The collapse of US stock market hegemony

What a rollercoaster.
The S&P 500 rallies about 1.5% in the first two days of last week, led by a 3.26% gain for the Nasdaq 100, only to turn around and sell off 1.3% through Friday’s close, led on the downside by, you guessed it, the Nasdaq.
The fundamental narratives to explain these swings have been equally mercurial.
However, let’s step back from the market’s day-to-day machinations and focus on the big picture:

Source: Bloomberg
This table shows the performance of 25 equity market indices since 2021 – the entire bear market cycle to date for most of these markets. In the table I’ve listed the 2021-early 2022 peaks for each and the date when each index set its intraday lows in 2022.
I’ve also listed the peak to trough decline and the total return for each index from their 2022 peaks through the close on February 16, 2023. All returns are listed in US dollars and include all dividends paid, which I assumed were reinvested in the index.
What stands out is the S&P 500 has been such an underperformer.
Since its highs in early January 2022, the S&P 500 is still down more than 13%, while the MSCI World index excluding US markets is down just 8.6% from its highs set a few months earlier in September 2021.
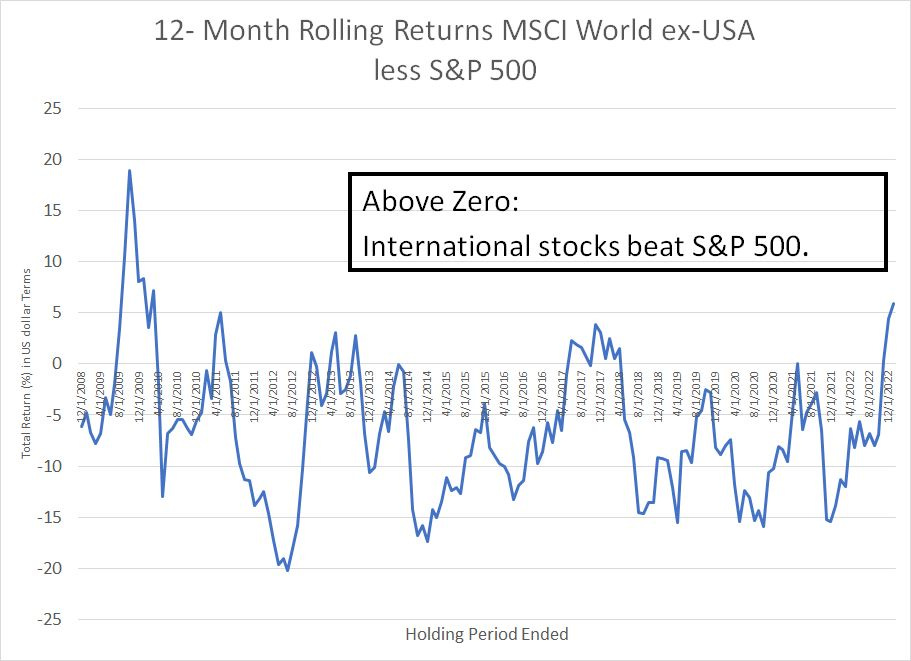
Granted, 5 percentage points of outperformance might not seem like a huge win for non-US stocks; however, it represents a massive shift from trends over the past 15 years or so. I calculated rolling 12-month total returns for the S&P 500 and the MSCI World ex-USA indices since the end of 2007 and, over this period, US stocks have beaten their counterparts elsewhere around the world almost 85% of the time.
Source: Bloomberg
Since 2007, equity investors from around the world could have performed well by following one simple rule:
Forget Europe, the UK, Latin America, Japan, China – forget everything and just buy the S&P 500 on any dip. To add insult to injury, the standard deviation of rolling 12-month annualized returns for the MSCI World ex-US Index was 18.4% over this time period compared to 16.43% for the S&P 500.
That means for the past 15 years, US stocks delivered much higher returns with less volatility and risk than international peers.
The “Innovation” that Drove Stocks Higher
The key to American equity hegemony has been large-cap tech and growth stocks.
Just consider, the Russell 1000 Value Index is up 356% since the end of 2008, the small-cap Russell 2000 is up about 348%, MSCI Europe is up 227% and the MSCI World Free Index (including the US) is up 210.1%.
Yet, over exactly the same time frame, the S&P 500 Growth Index is up a whopping 531% and the S&P 500 Information Technology Index is up 1,011.6%.
My table also shows the root cause of American equity underperformance through the recent bear market. Look at the equity indices that have performed worse than the S&P 500 since their 2021-22 peaks and you’ll find primarily a combination of US growth stock indices like the Nasdaq 100 and the Russell 2000 Growth (small-cap US growth) as well as China and emerging markets.
Indeed, many of these markets are still down more than 20% from their 2021-22 peaks despite a sizable rally that’s enveloped most markets around the world since late last year.
And even emerging market underperformance largely disappears if we simply exclude China from the equation – the MSCI Emerging Markets excluding China Index is down just 14.6% from its highs in February 2021, outperforming the broader emerging markets index by more than 10 percentage points.
Look at the top of the same league table, however, and you could be forgiven for wondering whether there’s even been a legitimate bear market over the past year. Indeed, you don’t have to go outside the developed world to find a large number of markets that are down less than 5% in US dollar terms from their bull market peaks – Australia, Italy, the UK and France are all on that list.
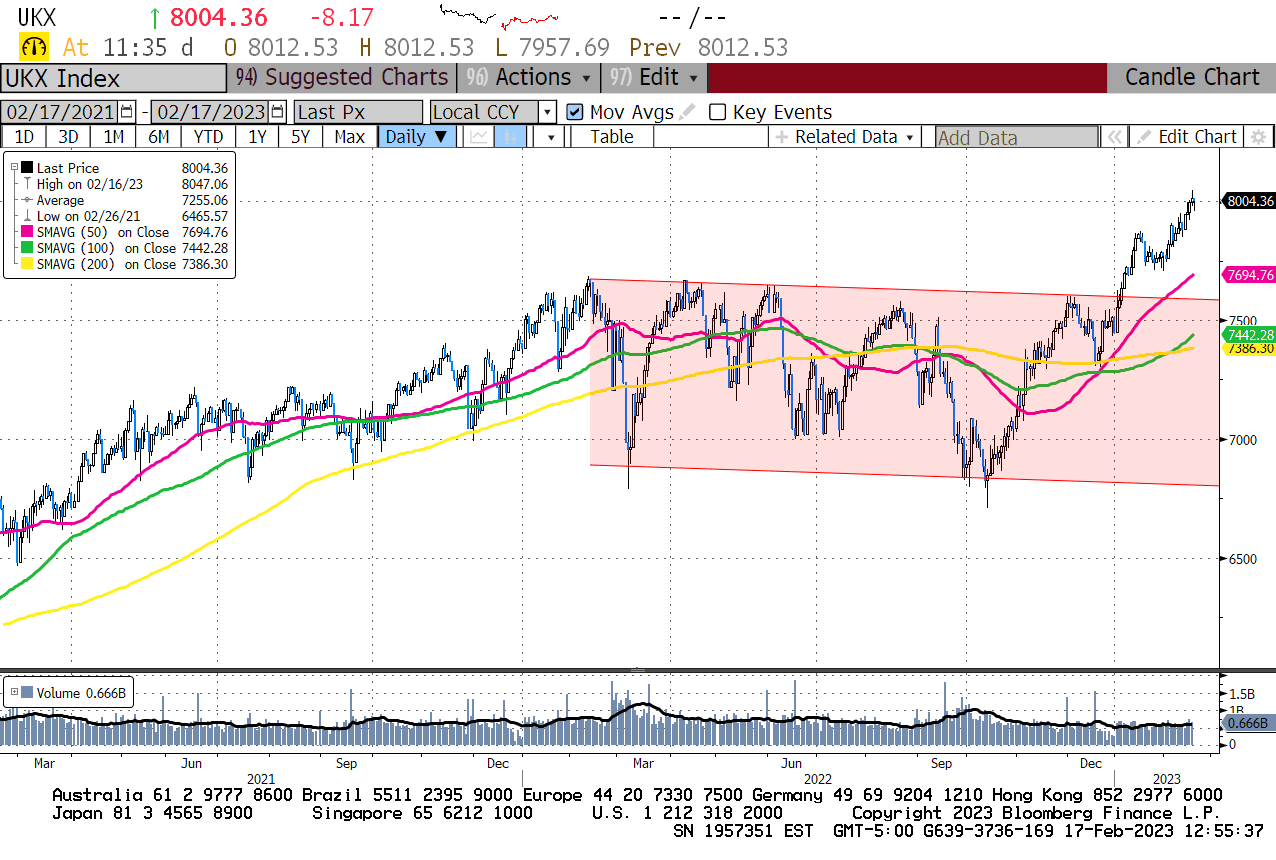
Just look at this chart of the FTSE-100 Index in the United Kingdom:
Source: Bloomberg
Granted, there’s been some major volatility in the FTSE 100 since the spring of 2022, but the index clearly broke to fresh all-time highs over the past few weeks.
Even in US dollar terms, the FTSE 100 is within a few percent of its 2022 peak and its maximum drawdown in 2022 of 23.4% is pretty close to that of the S&P 500.
The very same growth stocks that supercharged the S&P 500 following the financial crisis of 2007-09 now represent performance anchors.
The UK, Italy and France, for example, are all markets with more leverage to economically cyclical industry groups like financials, energy and industrials and comparative underweights in tech and growth sectors.
Of course, some – perhaps even a majority – of the surge in US tech stocks since 2009 is down to their capacity to innovate new products and services that consumers the world over wish to buy.
However, I’d argue that an equally important driver for growth stocks has been a different, and less impressive, sort of innovation in the form of a global experiment with easy money and negative real interest rates:
Source: Bloomberg
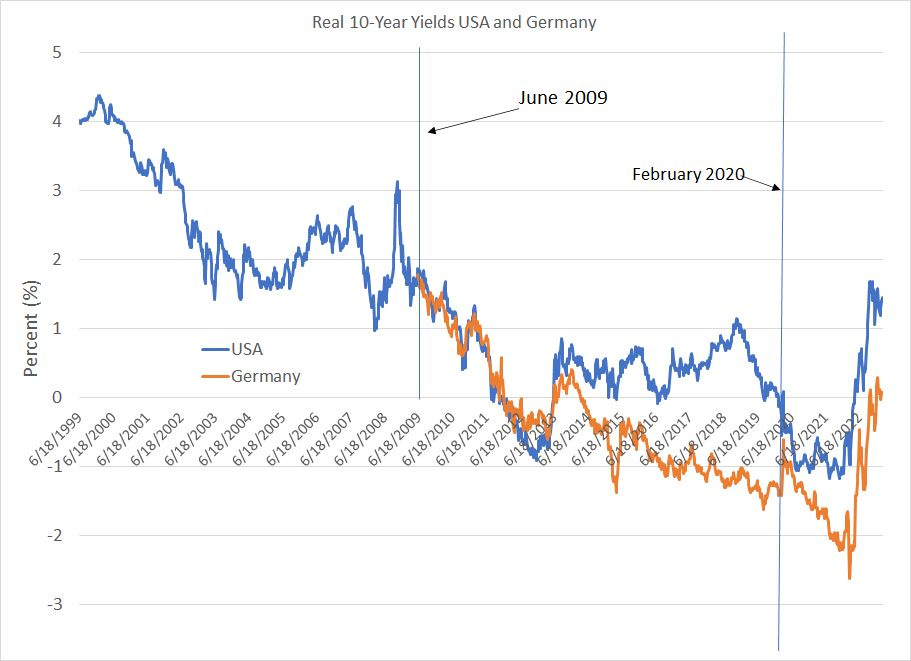
This chart shows the yields on 10-year US and German inflation-protected government bonds.
I only have data on German inflation-protected 10-year bonds back to 2009 while US 10-year TIPS began trading back in the 1990s. I’ve labeled the end of the 2007-09 Great Recession in the US (June 2009) as well as the approximate peak of global markets before the COVID lockdown crash in February 2020.
As you can see, both the US and Germany attempted to combat sluggish economic growth following the 2007-09 Great Recession and financial crisis with easy money – by 2012 or so, both US and German government inflation-linked bonds had a negative yield.
Once the precedent was there, the addiction to easy money proved hard to crack -- every attempt to boost real yields, even towards 1% or so, was met with a nasty stock market correction and economic slowdown. Thus, the Fed and the European Central Bank (ECB) both reversed course quickly, pushing real rates back toward zero in the US, and negative in Europe.
In late 2018, for example, the rise in real yields to just over 1% was the proximate cause of the mini-bear market in the S&P 500 in Q4 2018; the Fed, under current Chair Jerome Powell, quickly reversed course in 2019, cutting rates by summer.
Then, of course, the central bank response to turmoil following the COVID outbreak in early 2020 was swift, massive and predictable – a flood of quantitative easing and rate cuts sent real yields deep into negative territory.
Two points about all this.
First, technology and growth stocks – by definition – rely heavily on distant future earnings and cash flows to support current valuations. By driving interest rates to zero and then into negative territory after 2009, the Fed and other global central banks also drove down the equity discount rate, the rate at which future earnings are discounted to a present value.
This easy money boom significantly and directly encouraged expansion in valuations for the very technology and growth stocks that dominate the S&P 500.
This also explains the relative returns across markets since the 2021-22 highs – markets that benefited most from easy money have been hit harder as global central banks quickly drove rates back to positive territory – the highest levels since 2012 or so -- to fight inflation.
Second, much like Pavlov’s dogs, global equity investors have become accustomed to central banks acting quickly to drive down real yields at the first sign of economic or market turmoil.
That’s behind the ongoing fascination with the potential timing of a Fed (and ECB) pivot on rates this year – it also explains the tight negative correlation between equity valuations and expected peak Fed Funds rates that I’ve outlined in recent issues of The Free Market Speculator.
Short and Long-Term Implications for Stocks
At its heart, the stock market is a forward-looking mechanism that performs well when corporate profits are healthy and the outlook for continued growth is solid.
That’s why the market is a leading indicator for the US economy – stocks peak as investors begin to price in rising risk of an economic downturn and the accompanying decline in corporate profits.
That’s also why the S&P 500 generally peaks no more than a year before a recession starts – equity market investors collectively have significant foresight into the future, yet their crystal ball dims when focused on conditions more than a year or so into the future.
As I’ve written previously, the US equity market peaked in early January 2022, so if the historic relationship were to hold, the US economy should already be in recession, right now. But, the economy isn’t in recession, and it’s not likely to enter one until at least mid-year in my view, even though it’s still down 13%+ from those 2022 all-time highs.
I believe the most plausible explanation is that much of the decline in the S&P 500 to date is due to the rise in real rates and the breakdown of the post-2009 tendency for central banks to combat market weakness with easy money.
This also explains why Europe and other major global markets are outperforming the S&P 500 and, in some cases, close to entering new bull markets – since these markets have less leverage to rate-sensitive growth and technology sectors, they’re purer plays on traditional stock market drivers like economic performance and corporate profits than the S&P 500.
I doubt this rosy economic outlook will last for long.
You see, the talk of a soft landing or even a “no landing” scenario for the US economy remains an unrealistic fantasy – most of the leading indicators I follow and report on in this service are flashing red warning signs of recession ahead. And, if the message of the bond market – and the US yield curve—is even close to accurate, the coming downturn could be more severe than most equity market participants are anticipating.
I suspect a few factors such as labor hoarding, warm weather conditions in the US and Europe, some residual savings from 2020-21 era stimulus measures and seasonal revisions have combined to create a false “no landing” narrative so far this year.
However, by summer, the steady drumbeat of continued corporate earnings downgrades and deteriorating economic data should slam the door on that sanguine economic outlook.
Regardless of the exact timing of the coming recession, I believe there’s likely to be significant additional near-term upside for select stocks, investment styles and market sectors. And, what’s even more important is that we’re seeing a fundamental shift in markets underway right now that’s likely to be enduring.
Simply put, the more important shift is the transition from the low-inflation and low interest rate environment of the past 15 years to a prolonged period of higher inflation, higher interest rates and reduced reliance on monetary policy to dampen the business cycle. The beneficiaries of the prior low-inflation regime were primarily US growth stocks; new leaders are already emerging for the next cycle.
In coming issues I’ll dive a bit deeper into some of the generational shifts underway in global markets, what it means for investors over the next few years, and a few steps to potentially profit from the shift underway.
DISCLAIMER: This article is not investment advice and represents the opinions of its author, Elliott Gue. The Free Market Speculator is NOT a securities broker/dealer or an investment advisor. You are responsible for your own investment decisions. All information contained in our newsletters and posts should be independently verified with the companies mentioned, and readers should always conduct their own research and due diligence and consider obtaining professional advice before making any investment decision.