

When America Sneezes...
When America Sneezes...
The decade of US equity exceptionalism

The period since the Great Recession and financial crisis of 2007-09 has been one of US equity exceptionalism.
Take a look:
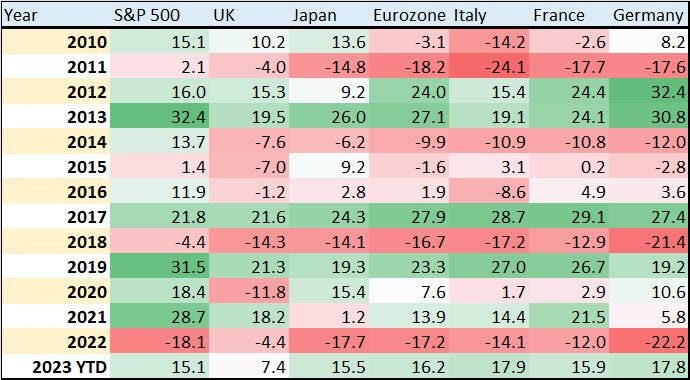
Source: Bloomberg
This table shows annual total returns for a few key stock market benchmarks worldwide since 2009. Specifically, I’m comparing the S&P 500 to the US iShares ETF corresponding to each national (or regional) stock market, so these all represent returns in US dollar terms.
As you can see, up until 2022 the US was a standout, handily outperforming most of the other markets on my chart in good years for stocks like 2013 and 2019 while holding up relatively well in bad years such as 2015, 2016 and 2018.
There are multiple reasons for this, but let’s focus on just two:
Economic Exceptionalism
First, US economic performance was broadly superior to the other regions and countries on my table from 2009 through 2021.
While it’s true US economic growth was subdued by historical standards through this era, other developed markets fared even worse. For example, Europe’s debt crisis in the 2010-11 era prompted a recession in the eurozone while the US avoided that fate.
And Japan, at least until recently, has struggled with deflation, unfavorable demographic trends, and sclerotic corporations reluctant to return capital to investors in the form of dividends and buybacks.
Second, the US stock market is dominated by an enormous technology industry.
Indeed, the tech sector accounts for a whopping 28.1% of the S&P 500’s market cap; if we include “tech-enabled” growth stocks like Amazon.com (NSDQ: AMZN) and Tesla (NSDQ: TSLA), which are not part of the S&P 500 Information Technology sector index, that weight jumps to around 50%.
Tech stocks, and growth stocks more generally, are long duration stocks, which simply means their present valuations are dependent on expected earnings and cash flows in the more distant future. Simply put, the longer the duration of an asset, the more sensitive prices are to the path of interest rates.
Think about it like this: A company is worth the net present value (NPV) of future cash flows and profit.
We all know $100 paid in 5 years’ time is worth less than $100 paid right now, the only question is how much less it’s worth. The answer to that question has to do with the discount rate applied to expected future earnings; the higher the discount rate, the less future earnings are worth compared to present profits or those to be earned over the next 1 to 2 years.
The prevailing level of interest rates and expected inflation are two factors that help determine the discount rate – when the risk-free rate of interest rises (say the yield on 90-day T-Bills) that will tend to drive up the discount rate.
After all, if you’re able to get a 5.25% annualized return from a risk-free T-Bill, you’re probably not going to accept an expected 5% or 6% total annualized return from buying a stock that carries a lot more risk and volatility. You’re likely to want more upside, a lot more upside, to compensate for that added risk.
So too expected inflation – if inflation is high, and to remain elevated, investors are likely to demand a higher discount rate to compensate for the expected loss of purchasing power.
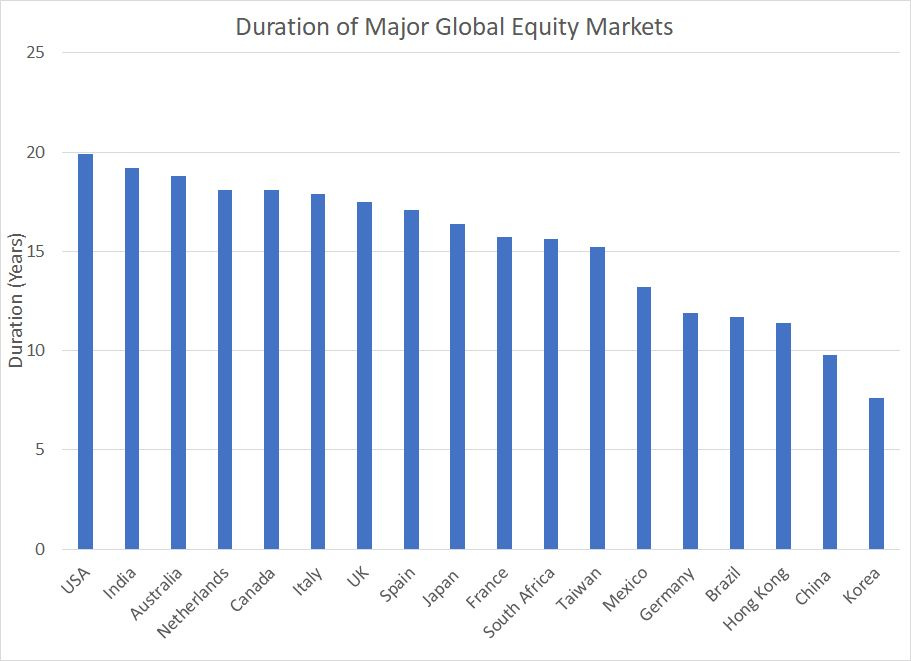
Source: Bloomberg Intelligence
This chart shows the duration of select major equity markets around the world, essentially a measure of how long it would take an investor to recoup their initial investment in an index based on the current level of profits.
As you can see, the US equity market has the highest duration of any index on my chart a full 2 years longer than Italy, 2.4 years longer than the UK, 3.5 years longer than Japan and 8 years longer than Germany.
So, the post Great Recession era was characterized by subdued global economic growth, low prevailing rates of inflation and low (even negative) interest rates, all factors that will tend to drive down the discount rate. Indeed, strategists at Bank of America pieced together a long-term history of prevailing interest rates and calculated global rates actually touched 5,000 year lows at times over the 2010-2020 era.
Since the US equity market is dominated by long duration growth stocks, it benefited disproportionally from the global era of easy money coming out of the 2007-09 financial crisis years.
And that brings me to this:
The 2020-21 Manic Phase and Hangover
These two factors also help explain why US stock market returns were so much better in the US than virtually any other market around the world in 2020-21 and why the US has lagged since that time.
The US government applied unprecedented fiscal and monetary stimulus in early 2020 and then doubled down on that strategy in early 2021, despite myriad warning signs the economy was overheating. Thus, US economic growth recovered more dramatically following COVID lockdowns, and real interest rates plunged further, aiding the long-duration US market.
Of course, these erstwhile tailwinds have morphed into headwinds for the US since the beginning of last year.
Surging inflation forced the Federal Reserve and other global central banks to hike interest rates at the most aggressive pace in four decades, driving up the discount rate. Meanwhile, rising rates and a hangover from the extreme levels of fiscal and monetary stimulus in 2020-21 slowed the US economy and threatened recession (more on this in a moment).
The US was the second-worst performing equity market on my table in 2022, besting only Germany, and it’s the second-worst performer again year-to-date ahead of only the UK.
The S&P 500 has been playing catch up more recently. The artificial intelligence (AI) stock craze has helped the S&P narrow the year-to-date underperformance gap with the iShares MSCI Eurozone ETF (NYSE: EZU) from a yawning 10.5% on April 26th to less than 1% today.
However, I’m not convinced this marks a return to a new era of long-term American stock market exceptionalism just yet.
After all, following a brief pause this spring amid the regional bank turmoil, the Federal Reserve looks on-track to resume hiking rates at its July 26th meeting. And market expectations for 3-4 interest rate cuts by early 2024 have vanished; traders now expect a Fed Funds rate at or above 5% through the Fed’s May 1, 2024 meeting.
The Bank of England (BOE) shocked markets last week by hiking its benchmark rate by a full 50 basis points to 5% rather than the 25 basis point hike expected. Traders are now pricing in roughly 40% probability the BOE hikes rates to a peak level of 6.25% by early 2024 – the “Old Lady of Threadneedle Street” hasn’t set rates that high since 1998.
The Nasdaq, and long-duration tech stocks, have thus far proved resilient in the face of a dramatic change in monetary policy expectations, in the US and elsewhere, over the past two months from short pause-then-cut to short pause-then-hike.
Further, it’s tough to look at a chart of the Nasdaq 100 without seeing room for more upside near-term:

Source: Bloomberg
Ignore the fundamentals for a moment and just look at this chart. The Nasdaq 100 has already retraced more than three-quarters of the entire 2021-22 peak-to-trough decline and we’re now close to retesting the March-April 2022 highs around 15,250.
Given the level of momentum apparent on this chart, and investors’ fear of missing out (FOMO) on more upside, it’s not out of the question we could see a retest of that late 2021 peak.
However, short-term momentum aside, it’s tough to suppose expectations for Fed rate hikes could continue to ratchet steadily higher while inflation remains buoyant without the world’s most long-duration equity market index succumbing to some selling pressure.
Right now, market expectations are:
The Fed hikes just once more this year, and cuts rates to 3.64% by the end of 2024, compared to the Fed’s “dot plot” projections for 2 more hikes in 2023 and rates at 4.65% by the end of 2023.
The one-year market-derived US breakeven inflation rate stands at 1.8% and expected long-term inflation (the 5-year, 5-year forward rate) stands at 2.23% compared to a current headline rate of 4% and core 5.3% year-over-year.
Somehow, the Fed will pivot and inflation will (magically) fall without the US tipping into recession – 64% of respondents to the Bank of America Global Fund Manager Survey (FMS) now expect a soft landing for the global economy with barely a quarter expecting recession.
The word “impossible” doesn’t exist in financial markets; however, at a minimum, there’s an awful lot that could go wrong with that set of expectations and the potential for upside surprise looks limited.
When America Sneezes...
There’s an old market saw that holds:
“When America sneezes, the rest of the world catches cold.”
And there’s some truth to that because, after all, the US still has the world’s largest economy, the world’s reserve currency, the US is rich in natural resources and has a massive domestic economy and consumer sector. Thus, if the US economy sputters, it’s usually going to have a dramatic knock-on impact on other economies around the world.
Amid all the talk of globalization, the US economy is comparatively closed in an economic sense. Trade — total imports and exports — for the US comprise 25% of Gross Domestic Product (GDP) compared to 57% for the United Kingdom, 89% for Germany, 63% for Italy, 61% for France and 37% for Japan.
The massive US domestic market confers a degree of insulation from economic shocks emanating from abroad.
Regardless, historically economic cycles on both sides of the Atlantic are closely correlated and the US doesn’t always lead:
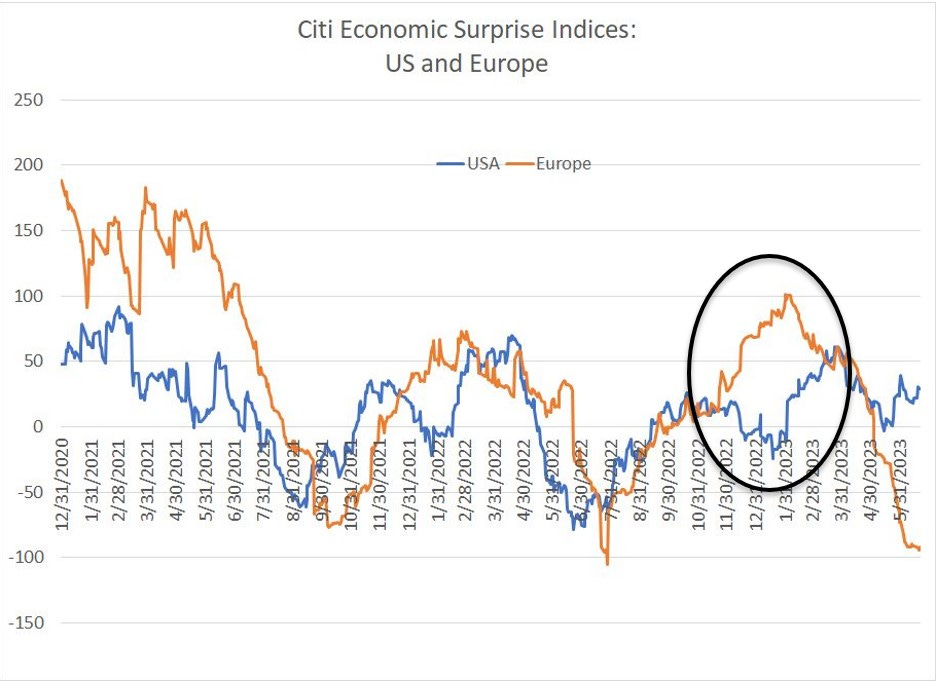
Source: Bloomberg
This chart shows the Citigroup Economic Surprise Indices for the US and Europe since the end of 2020 – a rising line indicates incoming economic data is better than expected while a falling line signals the opposite.
As you can see, the patterns are similar, though not identical.
For example, incoming US and European economic data both weakened starting in early 2022 through to around August. The European data weakened slightly sooner, which makes sense when you consider the headwind of an unprecedented spike in European energy prices following Russia’s invasion of Ukraine and the associated hit to regional economic growth.
However, look at the period I’ve circled on the chart. US economic data came in weak towards the end of 2022 and into early January; Europe diverged with the data dramatically besting expectations into early 2023. The US then played catch-up in the February-April period, even amid a regional banking crisis that disproportionately impacted the US financial sector.
Now Europe and the US are diverging again with European economic data deteriorating rapidly since March-April even as the US economy has fared comparatively well.
Late last week, the incoming data out of France and Germany spooked stocks:

Source: Bloomberg
S&P Global publishes a Composite Purchasing Manager’s Index (PMI) designed to track changes in activity across both manufacturing and service industries. It’s a diffusion index that’s similar in construction to the Institute for Supply Management’s (ISM) PMI Manufacturing and Services data series I’ve written about before in this service.
Levels over 50 indicate expansion and levels in the low to mid 40s generally signal recession.
As you can see, the Composite PMI for France fell to 47.3 in June, well below the 51.0 economists had expected, and to a new cycle low. For Germany, PMI sank to 50.8, above last year’s nadir but also a major miss compared to the 53.3 economists had expected.
It’s clear from both the plummeting economic surprise index for the Eurozone and the PMI misses for both France and Germany in June that the region’s economy is weakening and is at growing risk of recession, especially with the European Central Bank (ECB) still tightening policy to combat inflation.
The US Composite PMI also weakened to 53.0 and was below expectations for 53.5 though the scale of the miss is nothing when compared to the dramatic weakening we saw out of France and Germany.
History suggests that in coming months trends on both sides of the Atlantic should converge either through an improvement in European economic data or a deterioration in economic data in the US.
There’s no guarantee Europe is acting as the proverbial canary in the coal mine as it did in late 2022-early 2023. However, when you couple these trends with what we’re seeing out of China, I believe the case for a deterioration in US economic data into the second half of 2023 grows stronger:

Source: Bloomberg
This chart shows the Citi Economic Surprise Index for China, and the trend here is even more dramatic than for the Eurozone. The Chinese economy was eviscerated by the nation’s “Zero COVID” policy last year, and there was considerable optimism regarding a strong economic snap-back in 2023 as the economy reopened.
However, as you can see on this chart, the scale and durability of the country’s recovery has disappointed expectations.
So, can the US economy buck the weakening apparent in Europe, China and elsewhere, resist further monetary tightening and the resumption of falling bank reserves?
It’s possible though, in my view, increasingly unlikely that the US will remain entirely insulated from chill winds abroad.
DISCLAIMER: This article is not investment advice and represents the opinions of its author, Elliott Gue. The Free Market Speculator is NOT a securities broker/dealer or an investment advisor. You are responsible for your own investment decisions. All information contained in our newsletters and posts should be independently verified with the companies mentioned, and readers should always conduct their own research and due diligence and consider obtaining professional advice before making any investment decision.
Keep reading with a 7-day free trial
Subscribe to The Free Market Speculator to keep reading this post and get 7 days of free access to the full post archives.