

Where's the Panic?
Where's the Panic?
Don't Catch the Falling Knife

When the market gets hit hard, it’s only natural for traders to look for a potential “bounce” or bottom.
However, what’s most remarkable about the recent sell-off is the lack of real panic in the form of a washout or capitulation day for markets.
I’ve covered the NYSE Advancing Volume/Total Volume indicator on several occasions in issues of this publication, normally as an early warning signal for a potential significant market correction. However, it can also be used to help identify market lows – normally, in the final throes of a correction you will see days where 90% plus of volume traded on NYSE is in declining issues.
That’s a signal that the bulls are throwing in the proverbial towel and panicking.
We just haven’t seen that:
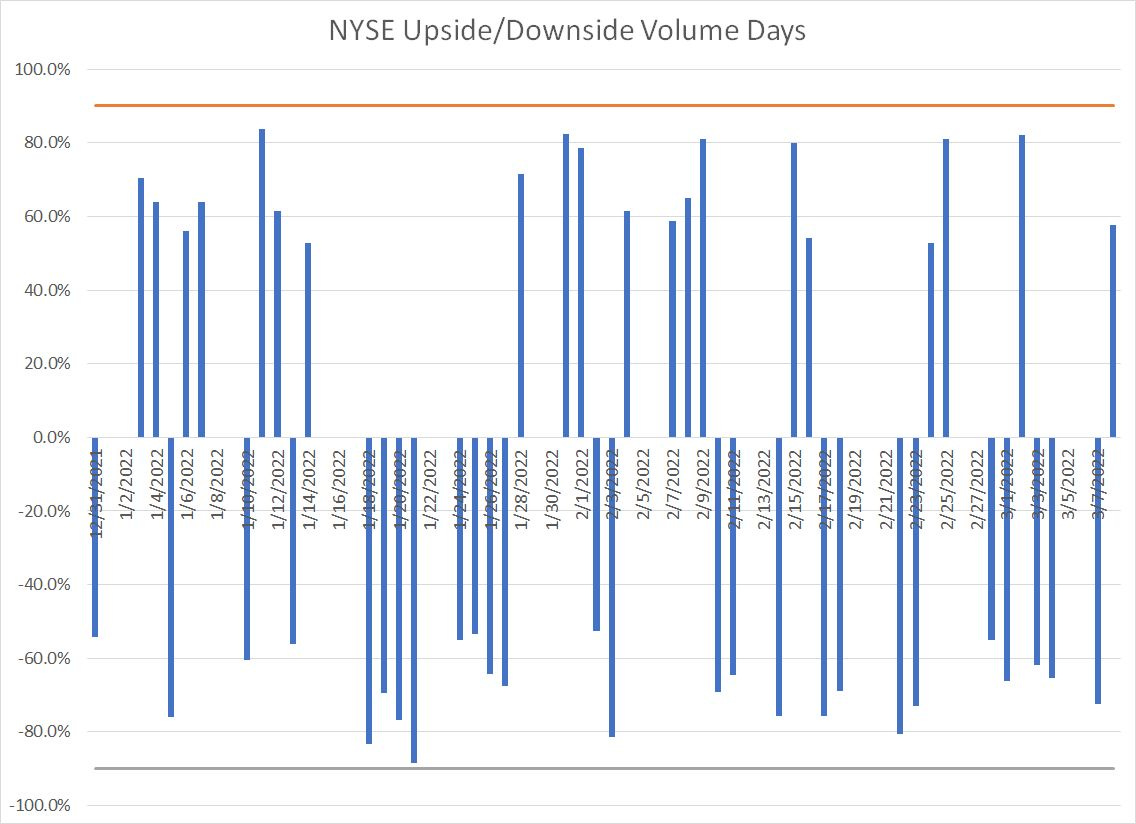
Source: Bloomberg
The last day when more than 80% of NYSE volume was traded in declining issues was February 22 and there have also been two 80% upside days since that time.
Contrast that to, for example, the situation in the summer of 2015:
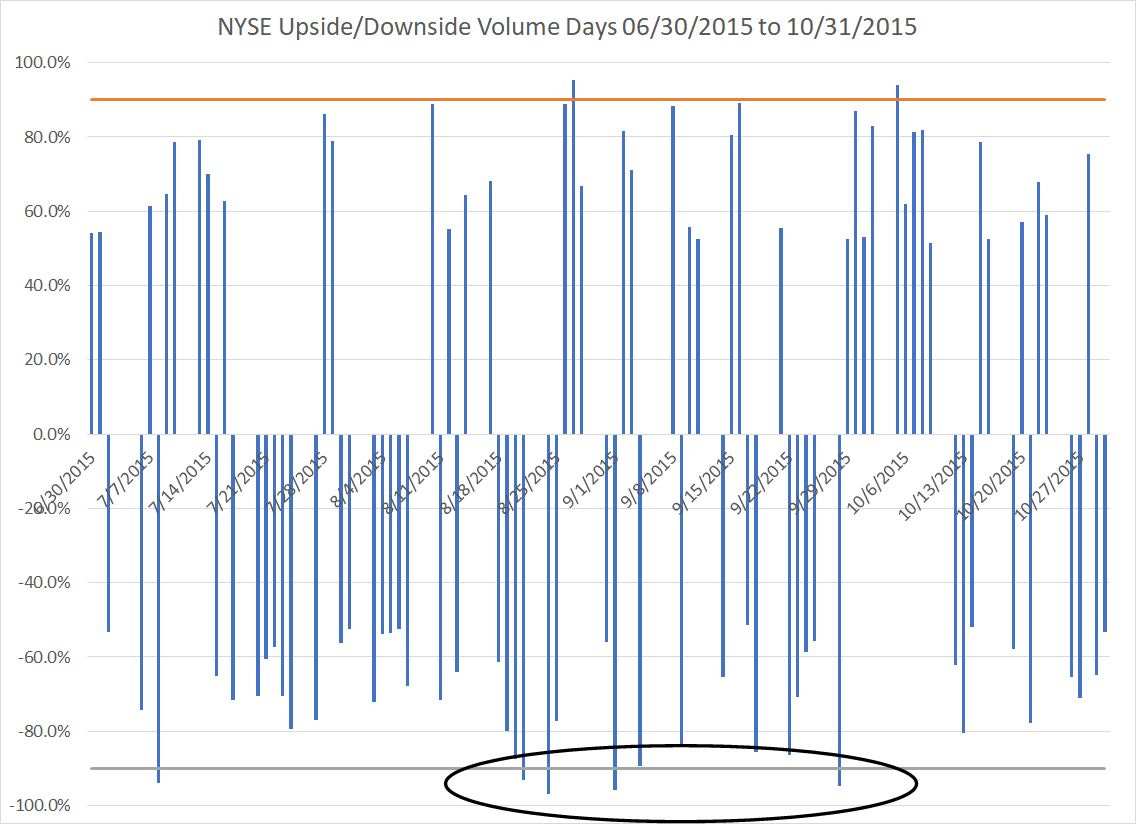
Source: Bloomberg
A proliferation of 90% down days starting in late August marked a significant bottom for the stock market.
Another indicator I watch is the S&P 500 Volatility Index (VIX) and, in particular, the ratio of the 3-month VIX (a measure of expected volatility over the next 3 months) to the VIX.
Take a look:
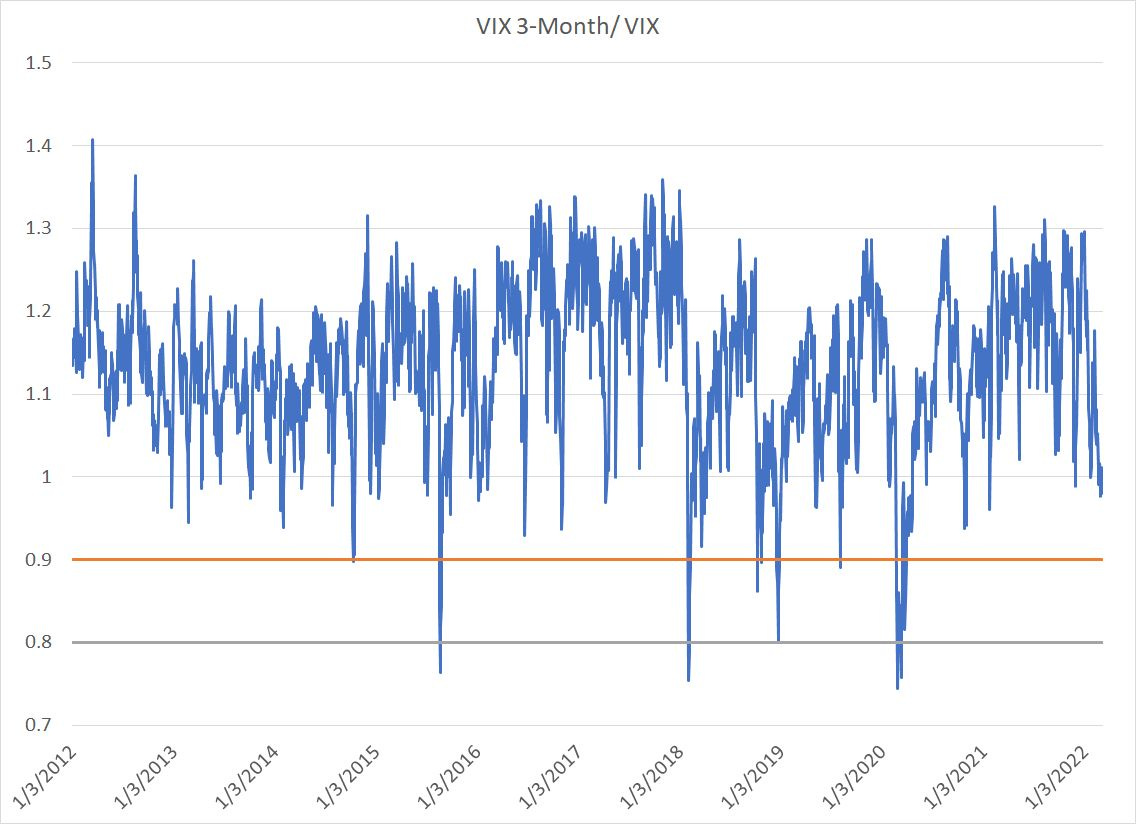
Source: Bloomberg
The VIX measures the amount of volatility priced into the S&P options market —high volatility indicates fear; traders are paying up top buy put options on the S&P 500 to hedge their downside exposure to the stock market.
So, consider what this ratio means – a number above 1.0 indicates that average market volatility over the next 3 months is expected to be higher than current volatility. Generally, this indicates a market that’s complacent – there’s not a lot of near-term fear priced into the options market.
In contrast, a low reading indicates a very high current level of the VIX and lower expectations over the next 3 months. Usually that means there’s panic – some event or concern that’s causing traders to aggressively hedge their market exposure, but that’s expected to ease over the longer term.
I’ve drawn to horizontal lines on my chart at 0.90 and 0.80. A spike down to around 0.90 is often consistent with a bottom in the context of a minor market correction.
And, as you can see, spikes below 0.80 are consistent with bottoms of more serious corrections or bear markets – this indicator spiked below 0.80 back near the lows in 2015 and amid the bigger sell-offs in early and late 2018. The coronavirus lockdown panic of March 2020 resulted in an even bigger panic, which registered as the lowest level recorded on this indicator in the past decade.
Don’t Catch the Falling Knide
Yes, the VIX itself has spiked to near 37, which is elevated. However, expectations for longer-term market volatility have been rising since late last year and the ratio of the 3-month VIX to the current reading is just 0.98.
Given the severity of the selling we’ve seen in the market, particularly the Nasdaq, since late 2021, I’d expect to see this indicator spike to close below (at least) 0.90 or (preferably) 0.80 to signal an imminent near-term rally.
Bottom line: An oversold bounce could come at any time; however, until we see more obvious signs of panic, it’s unlikely to mark the true bottom of this correction.
DISCLAIMER: This article is not investment advice and represents the opinions of its author, Elliott Gue. The Free Market Speculator is NOT a securities broker/dealer or an investment advisor. You are responsible for your own investment decisions. All information contained in our newsletters and posts should be independently verified with the companies mentioned, and readers should always conduct their own research and due diligence and consider obtaining professional advice before making any investment decision.