

Yield Curves, Recessions and Bear Markets
Yield Curves, Recessions and Bear Markets

The slope of the yield curve is one of the most respected and widely followed economic indicators in the world with good reason.
Inversions in the yield curve – where short-term interest rates are higher than long-term Treasury yields -- have a long track record of successfully signaling economic downturns since at least the 1950s.
At its heart, an inverted yield curve is a signal of tight US monetary policy. That’s because the Federal Reserve has the most control over short-term interest rates such as the 3-Month T-Bill yield or 2-Year Treasury yields; when these shorter-term yields are rising it’s a signal the Fed is tightening policy.
On the other side of the spectrum, yields on bonds like the 10-year Treasury reflect market expectations for longer-term economic growth, inflation and Fed policy – when the yield curve inverts, it means US economic policy is tight and the market expects growth, inflation and interest rates to fall over the longer-term.
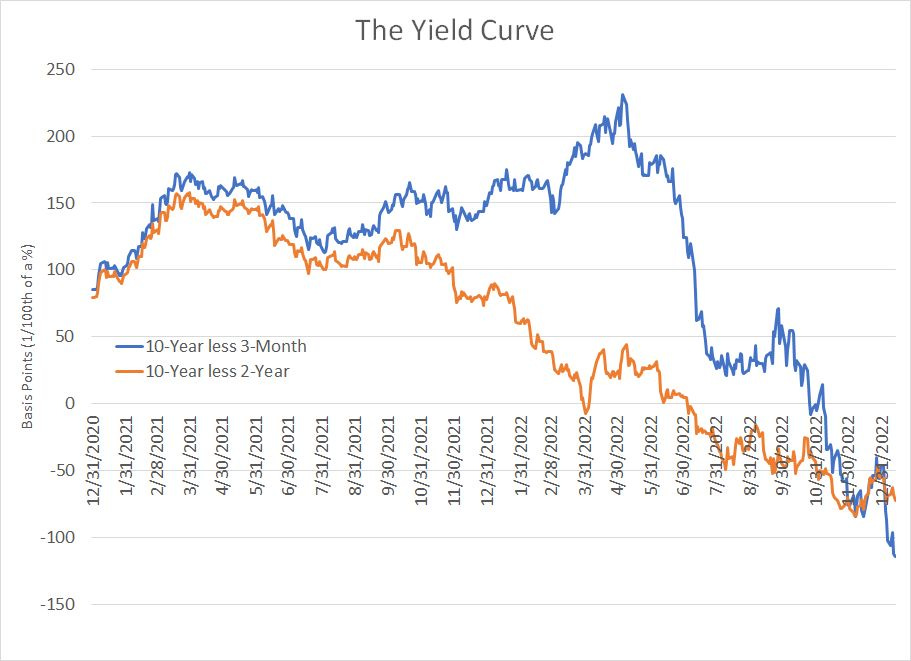
The two versions of the yield curve I follow most closely are the 10-year Treasury yield less 3-month rates and the 10-Year Treasury less 2-Year yields and both yield curve metrics have been inverted for weeks now:
Source: Bloomberg
As you can see, the 10-Year/2-Year yield curve (orange line) first inverted back in early April and has been continuously inverted since July 5th, a total of around 145 consecutive trading days. The maximum inversion to date was a little over a month ago in early December when the slope of the curve stood at negative 83.92 basis points.
Looking at the 10-Year/3-Month curve (blue line), it’s been inverted since late October 2022, for 49 consecutive trading days, and it’s currently at its most inverted this cycle to the tune of roughly negative 125 basis points.
So, clearly the yield curve is screaming that Fed policy is tight and inflation and US economic growth are likely to fall over the next few months – in response, the market is looking for the Fed to switch to an easing bias and for interest rates to come down.
Inverted to Steep
In most modern cycles it’s not really the curve inversion itself that’s a problem, it’s the steepening of the yield curve after inversion:
Source: Bloomberg
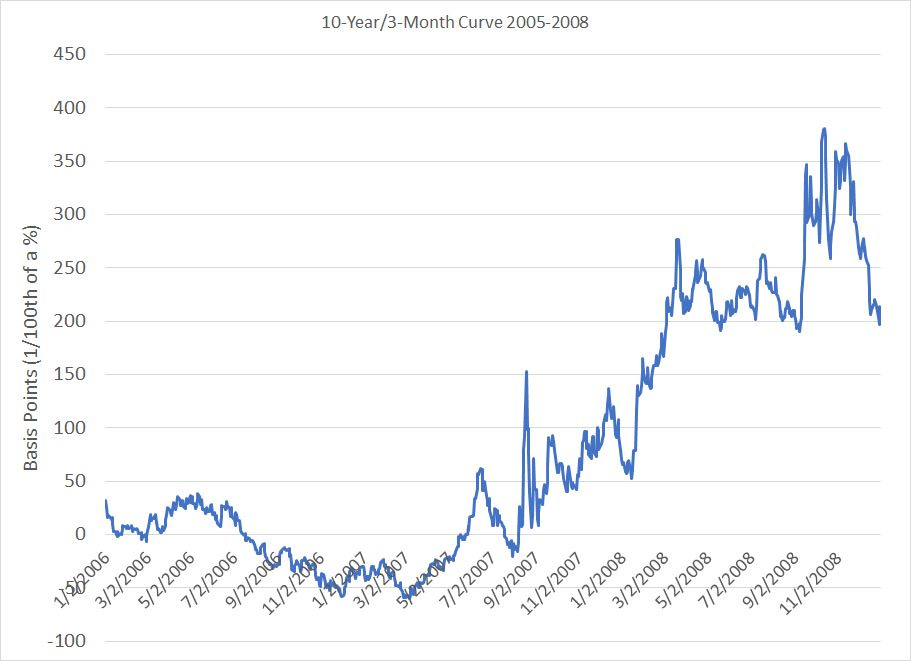
Here’s the 10-Year/3-Month curve from early 2006 to late 2008.
As you can see, the curve first inverted in February 2006, bounced around under +50 basis points until the summer of the same year, and then inverted in earnest starting in July 2006. The curve remained inverted for 224 trading days and saw maximum inversion of 59.53 basis points on March 7, 2007.
In this cycle, the stock market didn’t peak until early October 2007 and the economy didn’t enter recession until the end of the year.
However, note what happened to the yield curve in the second half of 2007 – the yield curve regained its positive slope, to a level as high as +153.3 on August 20, 2007 and as high as +380.33 in October 2008.
So, let’s look at what drove that re-steepening yield curve from -59.53 at the close on March 7th to +153.3 on August 20th, a shift of more than 200 basis points. Over this time frame, the yield on the 3-Month Treasury Bill fell almost 199 basis points (1.99%) while the yield on the 10-Year was up less than 14 basis points.
Thus, virtually all the re-steepening of the yield curve after March 2007 was due to expectations for the Fed to cut interest rates.
The Fed followed through on the market’s expectations delivering its first cut for the cycle on September 18, 2008; by the end of the year the central bank had reduced rates by 100 basis points (1%) to 4.25%.
That continued in 2008, the heart of the Great Recession and financial crisis. In 2008, 3-Month Treasury Bill yields plummeted over 300 basis points while the 10-Year yield was flat for the first 10-months of the year in the 3.25% to 4.25% range before falling to around 2% by year-end 2008.
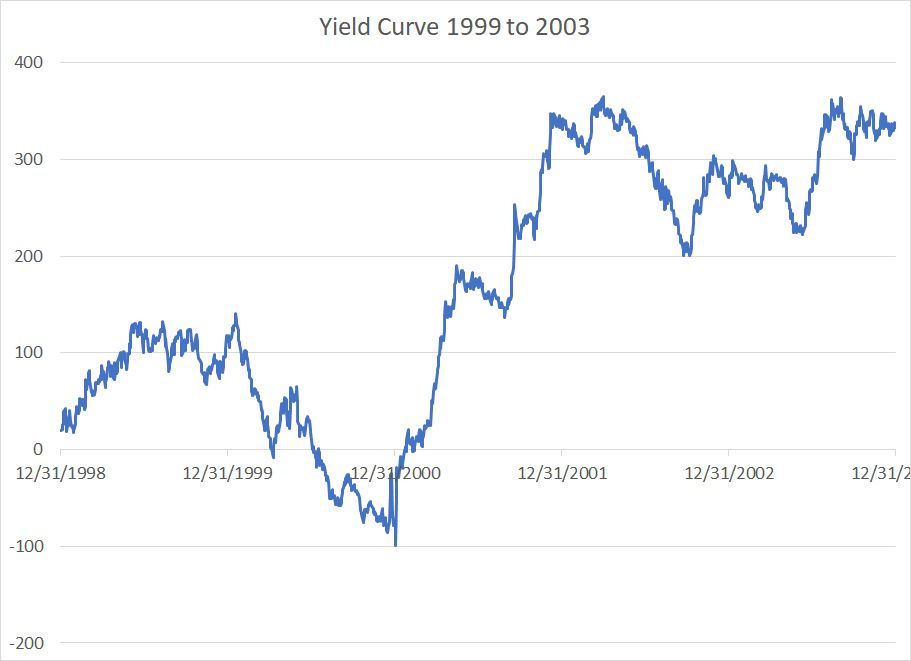
Here’s a look at the 2000-03 cycle:
Source: Bloomberg
A similar pattern in this cycle – the yield curve inverted for 142 consecutive trading days from the summer of 2000 to early January 2001, reaching maximum inversion of about -100 basis points.
The curve then steepened to a slope of around +365 by April 1, 2002.
The stock market peaked in March 2000, though the S&P 500 was still within a whisker of its peak into the autumn of that year, and the US economy entered recession in March 2001.
Much like the 2007-08 cycle, the steepening of the yield curve in 2001-02 was driven by the fall in short-term interest rates and Fed easing. US 10-Year yields remained rangebound through 2001 and the first half of 2002 between roughly 4.50 and 5.50% before falling as low as 3.11% in the summer of 2003.
Three-month T-Bill yields, however, plummeted from just under 6% in January 2001 to about 1.8% by April 2002.
Simply put, if the current cycle follows the pattern of the 2000-02 and 2007-09 cycles, the current yield curve inversion would continue for a considerable period, followed by a rapid re-steepening of the yield curve driven primarily by falling Treasury Bill yields.
When that re-steepening happens, US recession will be imminent.
In 2007, the yield curve first re-steepened to +50 basis points in mid-June 2007 about 6 months before the recession while in 2000 it steepened to +50 in early 2001 roughly coincident with the start of recession.
That’s also why calls for a major new bull market in stocks, driven by a Fed pivot, aren’t realistic.
If the Fed does NOT pivot in 2023 and instead maintains tight monetary policy through much of this year, the likely reason will be economic growth remains on reasonably solid footing and inflation remains buoyant. Tight monetary policy and stubbornly high inflation are, at a minimum, a headwind for the stock market, with long-duration technology and growth stocks likely to be the most challenged.
Even in a Goldilocks scenario the “Fed pivots, buy stocks” call makes little sense.
Let’s say inflation does gradually fall back to Earth this year and the economy slows but continues growing – basically a soft landing -- then why would the Fed pivot?
Having interest rates near zero while relying on policy tools like quantitative easing isn’t a comfortable position for the Fed – in a soft-landing scenario, I suspect they’d much rather keep interest rates near current levels, giving them some traditional monetary ammunition to combat future downturns.
Nor would Powell and the Fed be happy to see a return of speculation in ridiculous “meme” stocks and pseudo assets – the Tulipmania of our day – should they ease rates into a soft landing.
This Goldilocks scenario represents a sanguine outcome for the US economy and possibly for the stock market as well. That said, positive interest rates coupled with abandonment, at least temporarily, of extraordinary policy tools like quantitative easing would reinforce the shift in market leadership that’s currently underway.
If the Fed does pivot, and turns to aggressively cutting rates, that’s likely to be a consequence of rapid weakening in US economic growth and elevated risk of imminent recession.
This would result in the dramatic steepening of the yield curve much like in early 2001 and late 2007 – as you can see, most of the stock market declines associated with these two cycles happened after the US economy entered recession and the yield curve steepened.
And let’s consider one more possibility:
The 70’s Experience
As I just outlined, recent recession cycles in the US have consisted of three parts with respect to the yield curve:
1. A period of yield curve flattening, catalyzed by tightening Fed policy.
2. A prolonged period of 100+ trading days of actual yield curve inversion, representing the market view Fed policy is restrictive, and that growth will slow.
3. A rapid steepening just before the start of recession driven by falling short-term rates and growing expectations the Fed will cut rates to support growth.
However, while that’s been the case for the past four decades or so, it hasn’t always been that way:
Source: Bloomberg
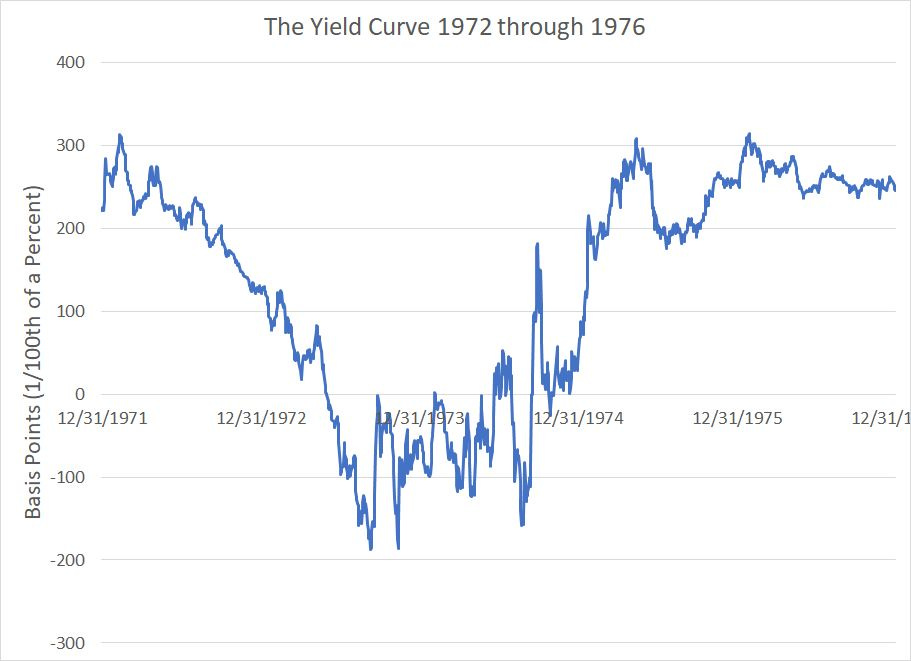
This chart shows the same measure of the yield curve (10-Year less 3-Month) from the end of 1971 through to the end of 1976.
As you can see, the yield curve inverted on June 1, 1973, and remained inverted until September 1974, a total of about 322 trading days.
Note: there was a brief period, between late June 1974 and August where the curve had a small positive slope before re-inverting to the tune of as much as 150+ basis points late that summer.
The maximum inversion of the yield curve ocurred in September and November 1973 when it reached a low of about -187 basis points.
The US economy entered recession in November 1973, a few months after the yield curve first inverted, but the yield curve did NOT steepen just before the start of that recession. Indeed, the yield curve didn’t steepen rapidly again until late 1974, not long before the end of the bear market in October 1974 and the end of recession in March 1975.
The reason, is that unlike more modern cycles, the Federal Reserve did not dramatically ease monetary policy ahead of the economy slipping into recession in late 1973:

Source: Bloomberg
As you can see, the US Federal Reserve went through several mini-tightening and mini-loosening cycles between the start of the recession in November 1973 until the ultimate peak of yields in late August 1974.
The reason for this volatility was the stubbornly high US inflation of this era. In effect, the wild swings in T-Bill yields in 1973 and 1974 represents the central bank’s unsuccessful attempts to calibrate rates at a level that reined in inflation without deepening an already nasty recession.
Indeed, even after the prolonged period of high short term yields you can see in this chart, US inflation was never fully quelled and surged to fresh highs in the late-70’s and early 1980s.
That, in turn, forced the Fed to tighten policy again under Paul Volcker into the early 1980’s, resulting in a double-dip recession and a second episode of a deeply inverted yield curve. At the lows in December 1980, the yield curve was inverted to the tune of almost 373 basis points.
It’s worth noting the last time the yield curve was inverted as much as it is right now was more than 40 years ago, during the Volcker “War on Inflation” era in the early 80’s. So, on this basis, the current cycle looks more like the 1970’s-early 80’s cycles I just outlined than it does the more modern episodes of 2000-02 and 2007-09.
My base case remains the US enters recession, likely by the middle of the year. This should bring down inflation somewhat as cyclical demand drivers wane, leaving the Fed with a choice – it could either respond by cutting interest rates aggressively as it has in modern times, or it could try to maintain an inverted yield curve (tight policy) as it did back in the 1970s and early 80’s.
I suspect the Fed will want to maintain tight policy until inflation shows real signs of retreating – I just don’t see the central bank pulling a preemptive pivot at the first sign of economic weakness or distress in the stock market, because to do so would risk reigniting inflation. However, I also suspect Powell is no Volcker – I doubt the Fed will have the fortitude to keep monetary policy ultra-restrictive in the face of deepening economic weakness.
Moreover, just like the 1970’s some of the root causes of inflation right now have little to do with the Fed, a prime example being the surge in crude oil prices driven by a lack of investment in new supply more than runaway demand.
The underlying problem right now is that most stock market participants have become accustomed to the Federal Reserve acting quickly to address market and/or economic weakness – either through dovish commentary and/or an outright Fed pivot. Thus, we’ve seen, and likely will continue to see in 2023, episodes of market strength driven by this low-probability Goldilocks dream scenario.
The more likely scenarios are:
1. The US economy slips into recession and only then the Fed pivots – that’s my base case.
2. The economy muddles through and inflation continues to slowly retreat, leaving the Fed with no reason to pivot on recent rate hikes.
Either way, the stock market is likely to remain under pressure and the ongoing shift in market leadership is likely to continue.