

Beating Estimates Offers No Upside
Beating Estimates Offers No Upside
Earnings season isn't going as well as most investors think

I keep reading headlines about how great earnings season has been for the S&P 500 so far.
And, I suppose, if you take the financial media’s favorite earnings season shortcut of simply comparing a company’s reported earnings per share (EPS) to the Wall Street consensus outlook before the release, this season has been strong.
After all, as of yesterday’s close about 68% of S&P 500 companies had reported earnings to date with 78.8% beating Wall Street consensus estimates while more than two-thirds had beaten estimates on the revenue line.
And let’s look at the aggregate earnings surprise for all S&P 500 stocks reporting to date as well as the four largest sectors in the S&P 500 by index weight:
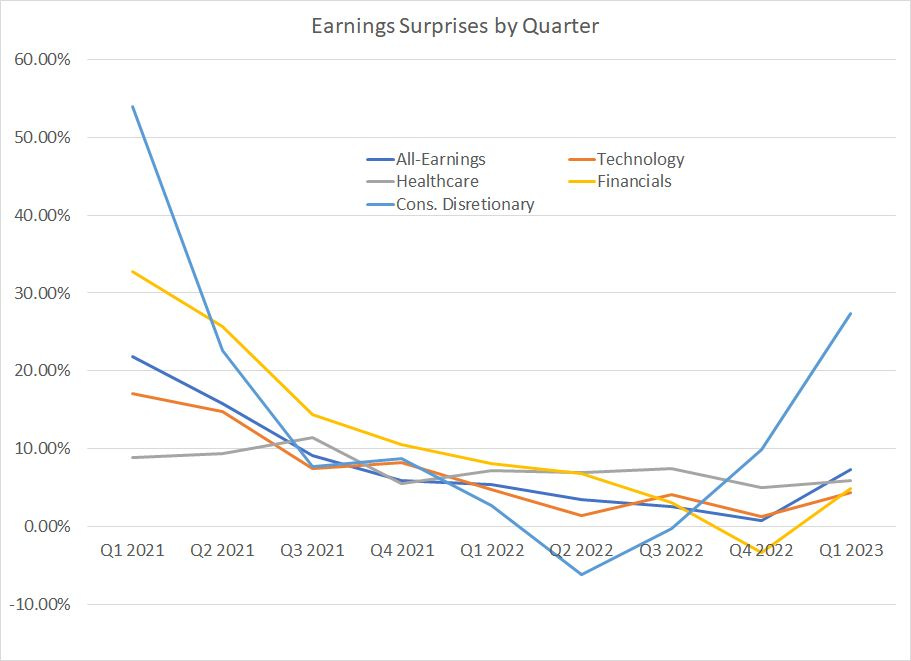
Source: Bloomberg
This chart shows how much S&P 500 stocks have beaten Wall Street consensus earnings estimates so far this quarter as well as for every quarter since Q1 2021.
Note how earnings surprises trended lower from Q3 2021 through the fourth quarter of last year. In Q1 2023, however, there’s been a notable improvement in earnings surprises for all securities in the S&P 500 as well as for every sector on my chart save health care. And health care earnings have limited exposure to the economic cycle, so I see little macroeconomic read-through, either positive or negative, from surprises in this group.
It should come as little surprise the decline in positive earnings surprises over this period roughly coincides with the bear market – the Nasdaq peaked in Q4 2021 and the S&P 500 in early Q1 2022.
However, as I noted in brief last week, the analyst consensus, and a company’s ability to beat those estimates, have little meaning in isolation. After all, Q1 2000 earnings season also delivered a significant positive surprise; yet, the stock market peaked in March 2000 and entered an historic bear market that didn’t end until late 2002.
And, just last week, Amazon.com (NSDQ: AMZN) reported adjusted earnings of $0.358 for Q1 2023, a 70.6% “beat” relative to analysts’ expectations for $0.21; yet, the stock fell almost 4% in the day after its report and has continued to fall since. Indeed, since Amazon comprises more than 23% of the S&P 500 Consumer Discretionary Index, it’s the main reason why the aggregate earnings surprise for the sector in Q1 2023 (the light blue line in my chart above) looks so positive.
I can’t stress this enough: What really matters in markets isn’t whether a company beats or misses analyst expectations, it’s how the stock reacts to the news.
Let me give you an example from one of the leading stocks of the bull market that ended a little over 23 years ago in March 2000:

Source: Bloomberg
This chart shows a price chart of Qualcomm (NSDQ: QCOM) from the end of 1998 through the end of 2001. The rectangles on the chart labeled “E” represent the dates on which QCOM released earnings results each quarter with a green block representing a QCOM beat on consensus earnings and a red block representing a miss.
In 1999, good earnings new for QCOM “worked” in the sense the stock beat estimates and following each beat, upside for the stock accelerated. In total, QCOM shares were up 2,619.4% in 1999 alone!
However, look what happened in early 2000.
On January 25, 2000 QCOM released earnings, delivering a 12.5% positive surprise; yet, that good news didn’t work and the stock tumbled 16.4% in the very next session.
The company beat on earnings again in mid-April and the stock opened higher to the tune of more than 6.3% the very next trading day; however, by the close on the day after the release, QCOM had cut that gain to just over 2%. And, just one week later, the stock was trading down 6.5% from its pre-earnings close.
Indeed, QCOM didn’t miss earnings estimates until July 2000; at that time, the stock was already down more than 68% from its intraday peak in January. And, before the bear market was complete the stock was down more than 86% from its all-time highs.
And here’s a notorious example from the 2007-08 cycle:
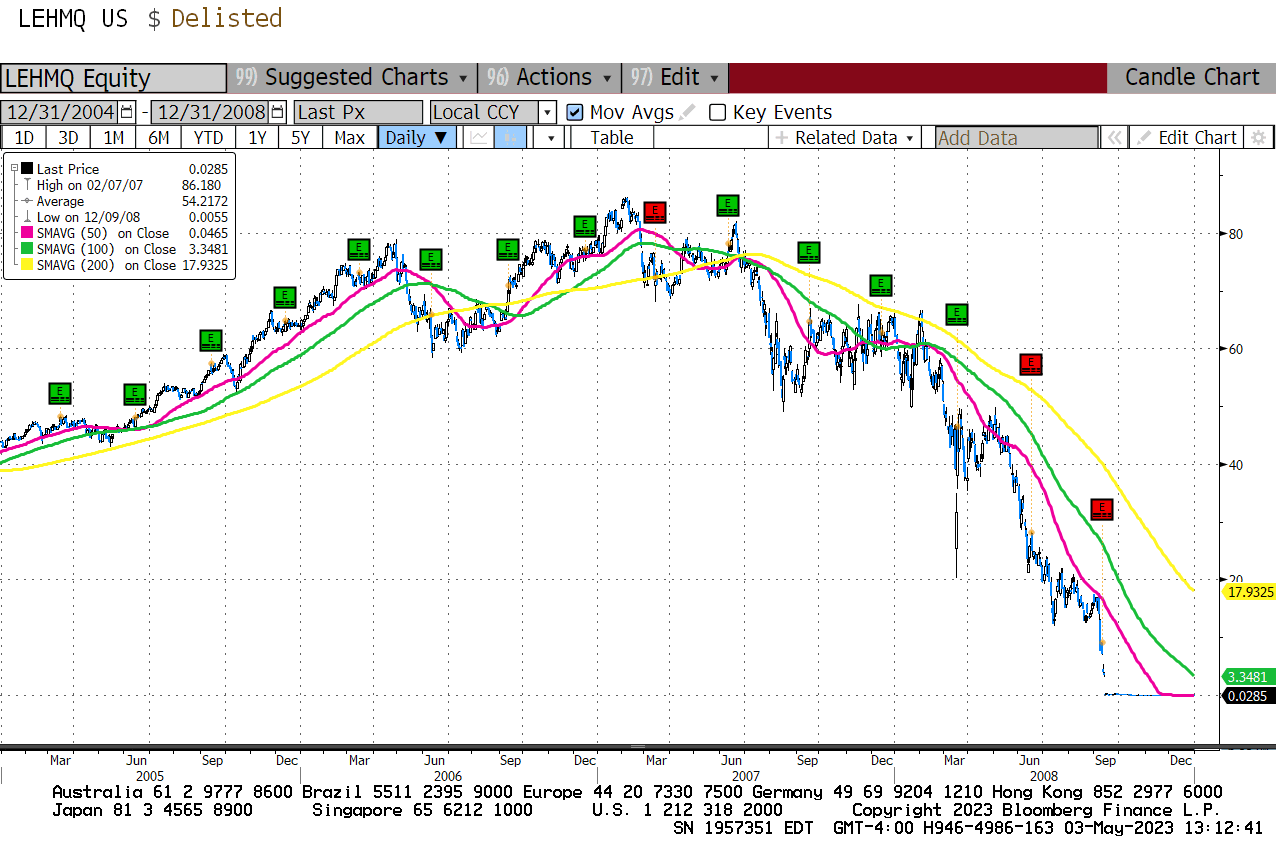
Source: Bloomberg
This is a chart of Lehman Brothers from the end of 2004 through the company’s spectacular failure and bankruptcy in September 2008.
As you can see, from the end of 2004 through to mid-2007, the company released 10 earnings reports and “beat” 9 times based on consensus estimates leading into each report.
On June 12, 2007, the company delivered a positive earning surprise of 16.3% and while the stock saw a short-lived pop over $80, it was trading below its pre-earnings close by the end of the month. The company’s September 18, 2007 release was even more problematic – even though Lehman beat expectations by 4% and the stock performed well on earnings day, the next day marked an important top for Lehman and it would not significantly exceed those intraday highs again.
Also note the company didn’t miss estimates until June 2008 after the stock had already plummeted more than 68% from its all-time peak and less than 3 months before it was bankrupt.
Two key points from all this.
First, just because many companies – even erstwhile market leaders -- are beating Wall Street earnings expectations doesn’t mean the economy won’t enter recession or the market doesn’t have further to fall.
As you can see from both examples, companies can beat earnings late in the cycle and after the economy has slipped into recession.
Second, a stock’s reaction to earnings news is more important than the news itself. Look for situations where a company beats expectations, perhaps even opens for trading higher on that news, and then sells off sharply despite the beat. As I’ve written before, that’s usually a sign that either all the good news is priced in or that there was something in the release that spooked traders.
Despite all the media’s focus on a company’s headline EPS and published Wall Street estimates, it’s often more subtle factors that drive a stock’s reaction in the aftermarket such as the tone of management on the subsequent conference call, commentary surrounding how demand evolved through the quarter, or any minor tweaks to guidance.
In this regard, the current earnings season doesn’t look quite so positive:
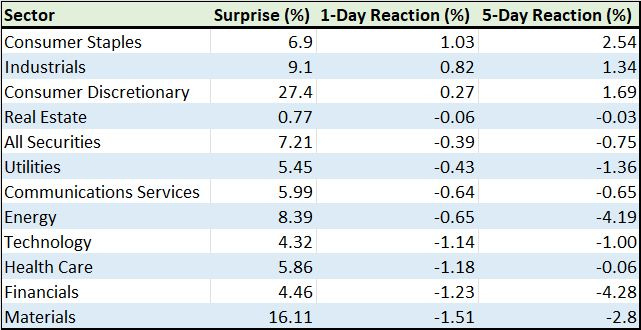
Source: Bloomberg
This chart shows the aggregate earnings beat for every sector in the S&P 500 as well as the 1-day and 5-day subsequent reactions for stocks reporting earnings to date.
As you can see, every one of the 11 sectors in the S&P 500 has beaten consensus expectations for calendar Q1 2023 earnings; yet, only 3 sectors have managed positive subsequent 1-day and 5-day price reactions.
And the real standout this season is the Consumer Staples sector, dominated by defensive food and beverage stocks that have been able to maintain strong margins by hiking prices to offset raw material inflation. As a result, these stocks have rallied by more than 1% in the day following their releases while jumping more than 2.5% in the subsequent 5 trading days.
Bottom line: Despite what you may be hearing in the mainstream financial media, most stocks aren’t delivering enough good earnings news to push stocks higher.
DISCLAIMER: This article is not investment advice and represents the opinions of its author, Elliott Gue. The Free Market Speculator is NOT a securities broker/dealer or an investment advisor. You are responsible for your own investment decisions. All information contained in our newsletters and posts should be independently verified with the companies mentioned, and readers should always conduct their own research and due diligence and consider obtaining professional advice before making any investment decision.