

Color Me Skeptical
Color Me Skeptical
Recession is far more likely than the crowd believes...

Editor’s Note: I’ll be speaking at the Money Show in Orlando, Florida on October 29-31, 2023. If you’d like to attend you can download the agenda and register for the conference by tapping here. And, if you do attend, be sure to introduce yourself — I’ll be in and around the exhibit hall throughout the show and can always be reached via e-mail at freemarketspeculator@substack.com.
The Federal Reserve met last week and decided to leave its Fed Funds target rate unchanged at 5.25% to 5.50% as the market has expected for weeks now.
All eyes were on the Summary of Economic Projections (SEP) and there the details were hawkish:
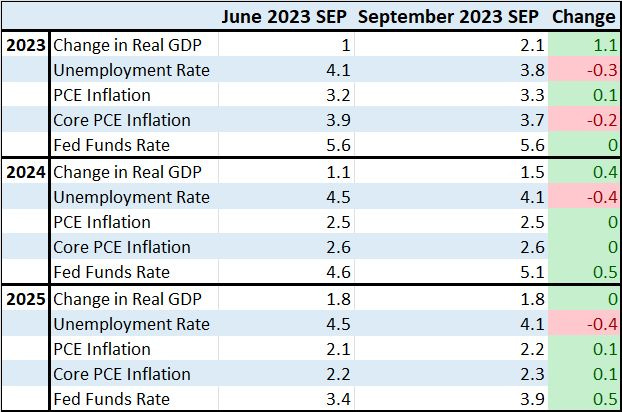
Source: Federal Reserve September Summary of Economic Projections
This table presents the median outlook of Federal Reserve Board members and regional Fed Bank presidents for economic growth, unemployment, inflation, core inflation and interest rates. I’ve presented the outlook for 2023, 2024 and 2025 and compare this week’s projections with the Fed’s last release of its Summary of Economic Projections back in June.
Bottom line: The Fed now sees economic growth much stronger, and the unemployment rate significantly lower, in both 2023 and 2024. Consequently, the Fed now sees interest rates remaining higher for longer – these projections pencil in one further rate hike for 2023 with rates to remain at 5.1% as of the end of next year (2024), down just 50 basis points from their peak.
Just 3 months ago in June, the Fed projections anticipated a full 100 basis points of cuts by the end of 2024.
Here’s a look at how market pricing (Fed Fund futures) for rates has shifted since May:
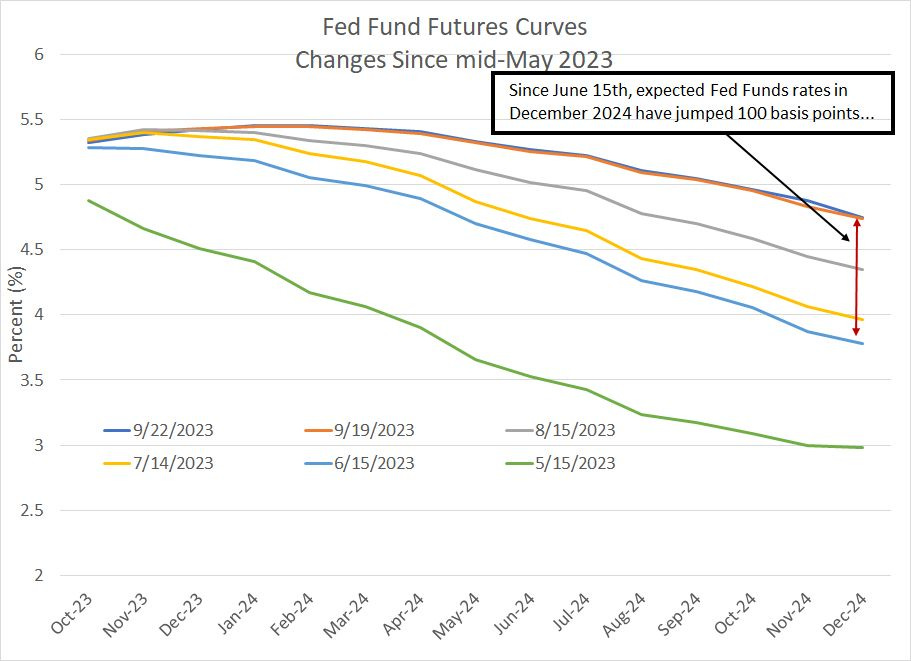
Source: Bloomberg
This chart shows the Fed Funds Futures curves for the months of October 2023 through December 2024 on six different dates from the middle of May 2023 through September 22, 2023.
In particular, focus on the changes in expected interest rates from June 15, 2023 (the light blue line) through the two readings I’ve plotted for last week: September 22nd (dark blue line) and September 19th (orange line).
As you can see, there really wasn’t much of a surprise regarding the Fed’s “dot-plot” of interest rate projections released on Wednesday as the September 19th curve (the day before the Fed announcement) is almost identical to the end of last week.
Moreover, the outlook for interest rates late this year is broadly unchanged – the futures had priced in a chance of one final 25 basis point hike this autumn back in June and, today, futures are still looking for about a 50/50 chance of a hike by December 2023.
The biggest change isn’t the outlook for peak rates in the current cycle but the outlook for a pivot on rates in 2024.
Back in June, the Fed Funds futures priced in a full 150 basis points in cuts through 2024 (1.5% in cuts) taking the Fed Funds rate down to around 3.75% by the end of next year.
Today, the Fed Funds futures curves sees just 50 basis points (0.50%) in cuts next year to a year-end 2024 rate of 4.75%, a full 1% higher than anticipated just 3 months ago in mid-June.
That, in a nutshell, is a graphical depiction of a higher-for-longer interest rate environment.
Put in a different way, you could say the median forecast at the Fed has moved from mild recession back in June to a full embrace of the soft-landing or even the no-landing scenario. The Fed also appears to be embracing the so-called immaculate disinflation narrative where there’s a magical decline in core inflation from 3.7% in 2023 to a near-target 2.3% by 2025 despite the unemployment rate rising only slightly from a 50+ year low to 4.1%.
Color me skeptical.
As I’ve pointed in “Recession: Same as it Ever Was,” it’s not at all unusual for the central bank and investing “crowd” to embrace a soft-landing narrative just months before the economy slips into recession.
Just consider that 23 years ago today in late September 2000, the upper bound of the Fed Funds rate stood at 6.50% and Fed Funds futures had penciled in a Fed Funds rate of about 6.4% for April 2001 (a small chance of one rate cut by April 2001).
Just 3 months later in December 2000, the upper bound of the Fed Funds Rate was still pegged at 6.5%, yet Fed Funds futures were looking for the Fed to cut rates to 5.79% by April 2001 and to around 5.50% by August 2001.
The 2001 reality:
By mid-April 2001, the Fed had slashed rates by 200 basis points to 4.50% and by the end of August 2001 the upper bound of the Fed Funds target stood at 3.5%, a full 300 basis points in cuts in less than a year.
A year later in September 2002 rates stood at 1.75%, an historic low at the time.
Of course, the reason for this rapid change was that the US economy entered recession in March 2001 and the decline in the broader stock market sell-off worsened in late 2000, prompting the Fed to start a major rate cut campaign months earlier than almost anyone expected.
On September 12th, 2023 Bank of America published its monthly Global Fund Manager Survey, showing 74% of managers surveyed now believe the US economy will achieve a soft landing or even a no landing scenario while less than a quarter of respondents expect recession. Yet, despite the US economy’s resilience in the face of the Fed’s recent spate of rate hikes, almost 70% expect lower global inflation.
As I explained a little earlier on, that’s almost the same exact outlook the Fed endorsed in its September economic projections released last week.
Perhaps the consensus of central bankers and the investing crowd is right this time -- maybe the Fed will stick a perfect soft landing with inflation under 2.5% or so by the end of next year; after all, there really is no such thing as impossible in financial markets.
However, when the crowd is all leaning in the same direction, history suggests there’s a nasty surprise in store – I continue to believe that much like 23 years ago in September 2000, stocks and bonds are underpricing the risk of a hard landing.
Recessions come at you fast.
The Short-Term for Stocks
September is a terrible month for stocks; however, the October through December period is far stronger:

Source: Bloomberg
Indeed, you could say the S&P 500 is tracing out a box-standard seasonal pattern this year – the index was up in the seasonally strong month of July, and has experienced a correction in August and September, the weakest two-month stretch of the year from a seasonal perspective.
We’re now about to flip back to a seasonal bullish bias – as you can see in my chart above, October-November represent a mirror image of August-September, the strongest two month stretch of the year.
Combine that with this:

Source: Bloomberg
This is a daily chart of the S&P 500 since late 2021. As you can see, over the past few trading days, the S&P 500 has (finally) slipped into the support zone between the 100-day and 200-day moving averages on this chart. This is a region I’ve been flagging for weeks now to watch on corrections – currently it’s between roughly 4,190 and 4,375.
Typically, in a bull market the S&P 500 will find support at or a percent or two below this range. So, it’s quite possible that we’re seeing just that right now – a typical late summer correction into an obvious support level ahead of a year-end ramp higher.
If you’re an Old School market technician you’ve probably also spied an obvious head-and-shoulders top I’ve labeled here that projects down to around 4,100 to 4,150 on the S&P 500. Again, nothing at all unusual here – such a move would represent a 10% correction from the S&P 500’s July 31, 2023 closing peak at 4,589 at a time of year when it’s normal to see equity market weakness.
So, these factors render me reluctant to jump on the bears’ bandwagon right now.
I would stress my intermediate to long-term market outlook is based more on the far-more-bearish economic and market fundamentals I’ve written about in recent posts for The Free Market Speculator.
So, let’s turn to commodities:
The Short-Term for Commodities
Let’s take a quick look at the Bloomberg Commodity Index:

Source: Bloomberg
This chart shows the Bloomberg Commodities Index Since the autumn of 2021 – note this index includes commodities like oil and natural gas as well as metals and agricultural commodities.
Commodities have been in a significant downtrend since the summer of 2022; however, the index saw a bottom in May-June and has rallied back above that 200-day moving average.
Also, I see an inverted head-and-shoulders basing pattern here that would resolve in bullish fashion with a rally above resistance at 108-109 on this chart.
Further, some key widely watched commodities – including oil – have already broken out, raising the probability the rally will broaden out.
In short, for commodities the constructive technical picture aligns with my constructive fundamental long-term outlook – the commodity supercycle – which is one reason why we have multiple recommendations in commodity-levered stocks in the model portfolio within the paid tier of The Free Market Speculator including recommendations with upside leverage to natural gas, oil, precious metals and agriculture.
Treasuries: No Sugar-Coating this Chart
Lastly, Treasuries:
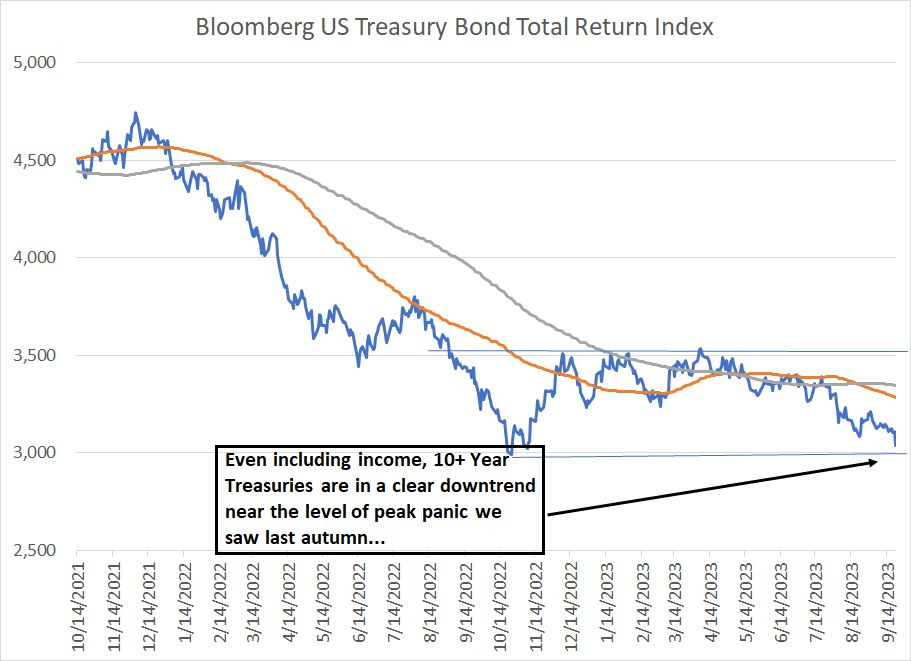
Source: Bloomberg
There’s no sugar-coating this chart – even looking at the total return index on 10+ Year Treasuries, which includes the positive impact of interest income received, this chart is in an ugly downtrend.
The positive I see is that we’re approaching a similar level of panic in Treasuries to what the market experienced last autumn – bonds are oversold – just as the crowd consensus embraces three key ideas:
1. Economic soft-landing
2. Immaculate disinflation
3. Higher-for-longer rates
As I outlined earlier that’s a triple-threat bearish narrative for bonds – the contrarian call is now clearly that recession is likely with Treasuries benefiting from a flight-to-safety trade.
DISCLAIMER: This article is not investment advice and represents the opinions of its author, Elliott Gue. The Free Market Speculator is NOT a securities broker/dealer or an investment advisor. You are responsible for your own investment decisions. All information contained in our newsletters and posts should be independently verified with the companies mentioned, and readers should always conduct their own research and due diligence and consider obtaining professional advice before making any investment decision.