

Forget the Fed, It’s the Economy
Forget the Fed, It’s the Economy
Long-term Treasury yields have peaked this cycle

The market hangs on every word uttered by Jerome Powell and prominent FOMC members.
And it seems every other article I read these days focuses on soaring bond yields and the potential for the Fed to maintain rates at the current level over the long haul to conquer inflation.
The consequent positive correlation between the stock market and bond prices – stocks and bonds (prices NOT yields) move in the same direction – has flummoxed investors accustomed to the post-1982 tailwind of an historic Treasury Bond bull market and government bonds’ haven status.
However, the real focus for the bond market this year isn’t ultimately the Fed, but the economy:

Source: Bloomberg
I’ve plotted two lines on this chart – the Bloomberg Economic Surprise Index (blue line, right-hand scale) and the yield on 10-Year Treasuries (green line, left-hand scale) through the end of last week.
The Bloomberg Economic Surprise Index examines incoming economic data relative to consensus Wall Street expectations ahead of the release where better-than-expected data boosts the index and worse-than-expected data causes it to fall. The index utilizes a 6-month lookback window; however, it’s smoothed such that older data becomes less impactful to the calculation over time.
Simply put, when this index is rising consistently, it’s a sign the US economy is stronger than Wall Street expected and vice versa.
Look at the yield on the 10-year so far this year.
Up until early August, the 10-Year Treasury Yield was roughly rangebound in a 70-basis-point range between 3.30% and just over 4%. Yields didn’t run away to the upside until around August 2nd when the 10-year yield closed at a new 2023 high of over 4.07%. Then over the space of less than 3 months, 10-year yields galloped higher to around 5% on October 19th.
Now compare this with the trend in the Bloomberg US Economic Surprise Index – this index was rangebound between about -0.14 and +0.14 from November 2022 up until around the middle of May this year.
This range-bounce action around zero suggests an economy that’s not necessarily strong, but is behaving about as expected with some economic data coming in hot and some on the cold side. Simply put, 10-year Treasury yields were rangebound up until August because the outlook for the economy was mixed.
As I said, the Bloomberg Economic Surprise Index really took off starting in May, reaching an absolute high of 0.62 on July 6th and then sustaining a high plateau between about 0.40 and 0.55 from mid-July to early October. This is a signal that US economic strength surprised to the upside for much of the May to October period.
It's an open debate how much of this strength was real rather than statistical anomalies in data such as the monthly payrolls number, which is something that I covered in my November 7th post on FMS, “Recession Risks Rising.” However, the fact remains the published data was stronger than “the market” had anticipated and that catalyzed a jump in yields (selloff in bonds) coupled with a stronger stock market.
That’s logical, at least superficially, because stronger economic growth benefits stocks in the form of increased earnings potential, and it hurts bonds because it means interest rates will likely need to move higher or, at least, remain at elevated levels.
This year moves in this economic surprise index have tended to precede, or lead, moves in yields. The economic surprise index started to break higher in May, stabilizing at an elevated level in July-October, and bond yields followed suit by breaking higher in early August.
Similarly, the US Economic Surprise Index broke lower in mid-October and is now back to levels last seen in mid-May of this year.
So, with the economy starting to surprise to the downside, is it really a shocker yields have peaked?
The yield on the 10-year Treasury hit a closing peak of 4.99% on October 19th ended last week at 4.65% and plunged to as low as 4.43% this morning following a softer-than-expected Consumer Price Index (CPI) inflation report. Similarly, the yield on 30-year Treasuries hit a closing high of just under 5.11% on the 19th as well, the highest in more than 15 years, and has since retreated to around 4.60% to 4.65% today.
In essence, despite all the talk about the Fed, longer term yields are ultimately following the prospects for the economy – a stronger economy acts as a headwind for bonds and results in rising yields. The flip side of that is that when there’s been a rising perceived risk of a recession this year, bonds have rallied, and yields have fallen sharply.
The Current Situation
That brings us back to the current situation.
The US economic surprise index has been breaking meaningfully lower for a little over a month now. It’s possible that’s just noise – economic data is inherently noisy – however, as I explained in my “Recession Risks Rising” post on November 7th and my October 31st piece, “Earnings and the Deteriorating Market Outlook,” the risks for the US economy appear skewed to the downside, and I believe recession remains the most likely result.
If there is a recession, or even just a significant slowdown in the economy into the first half of 2024, the Economic Surprise Index would almost certainly continue to fall. At a minimum, I’d expect to see this index back below zero at some point in the next few months.
That’s a tailwind for bonds.
Given the tight, albeit lagged, relationship between the economy and yields I just outlined, it’s not unreasonable to expect 10-Year Treasury yields to revert to their early 2023 range of 3.30% to 4.00% should the US Economic Surprise Index decline to its own early 2023 range.
Of course, the same basic forces should impact stocks. Specifically, since positive economic surprises seem to have supported the rally in stocks from May through July –the S&P 500 was up about 10.5% from the end of April through the end of July -- a major deterioration in the health of the economy could be expected to have the opposite effect.
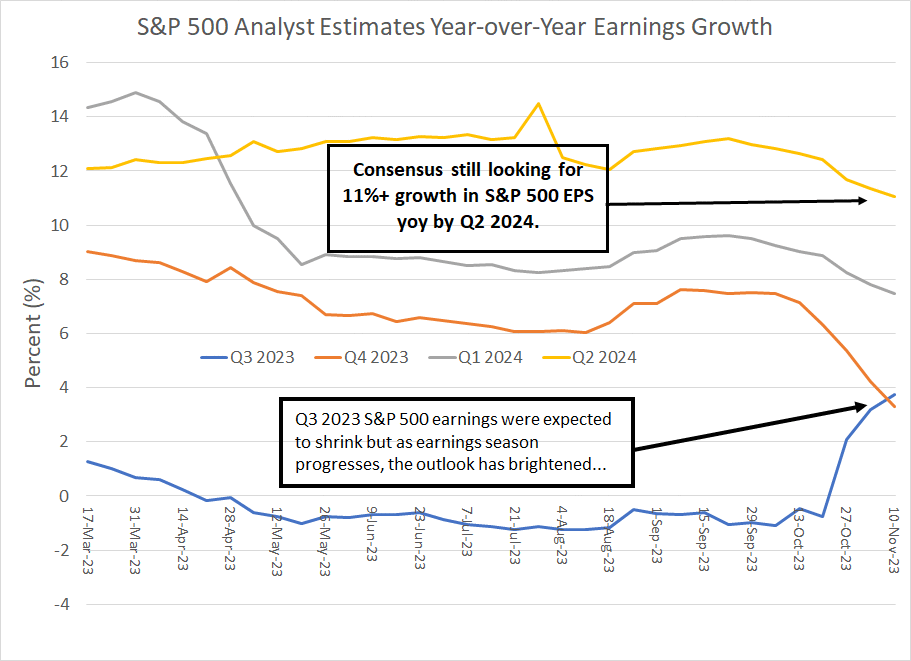
After all, if there is a recession, or even just a meaningful slowdown, earnings expectations for the S&P 500 through 2024 look extraordinarily optimistic:
Source: Bloomberg
This chart plots consensus expectations for year-over-year growth in S&P 500 EPS by quarter from Q3 2023 (current reporting season) through to Q2 2024.
Look at the blue line. Analysts had been looking for S&P 500 earnings to shrink year-over-year in Q3 2023; however, as companies began to report earnings starting in mid-October it became clear they’d beat expectations on Q3 2023 and you’ve seen a commensurate jump in earnings expectations.
However, while Q3 2023 earnings have been solid, the problem has been weak guidance for future growth – you can see that weak guidance in the form of analysts marking down their outlook for Q4 2023 (current quarter) earnings depicted in the chart above.
Longer term, there’s been little impact – indeed, Wall Street is still looking for Q2 2024 earnings to grow a whopping 11% year-over-year, down only a bit from around 12% to 13% in mid-August.
If there is a recession, as I expect, that’s a pipe dream.
However, if there’s one thing, I’ve learned in the past 25 years it’s to never underestimate the short-term power of hope and optimism in equity markets.
Stocks can get bid higher in the short run even as it becomes clear the economy is weakening; indeed, historically the final 12 months of a bull market in the S&P 500 brings some of the strongest returns of the entire cycle. And, the most powerful short-term rallies in history have occurred during bear markets, NOT bull markets.
Given the strong seasonal positive bias in the final two months of the year, the probability of an end-of-year rally remains elevated regardless of the fundamental news flow. Indeed, it could well be the Nasdaq 100 – the leadership index this year – may even take retreating long-term bond yields as a positive on the view that growth stocks benefit from low yields and consequent low discount factors.
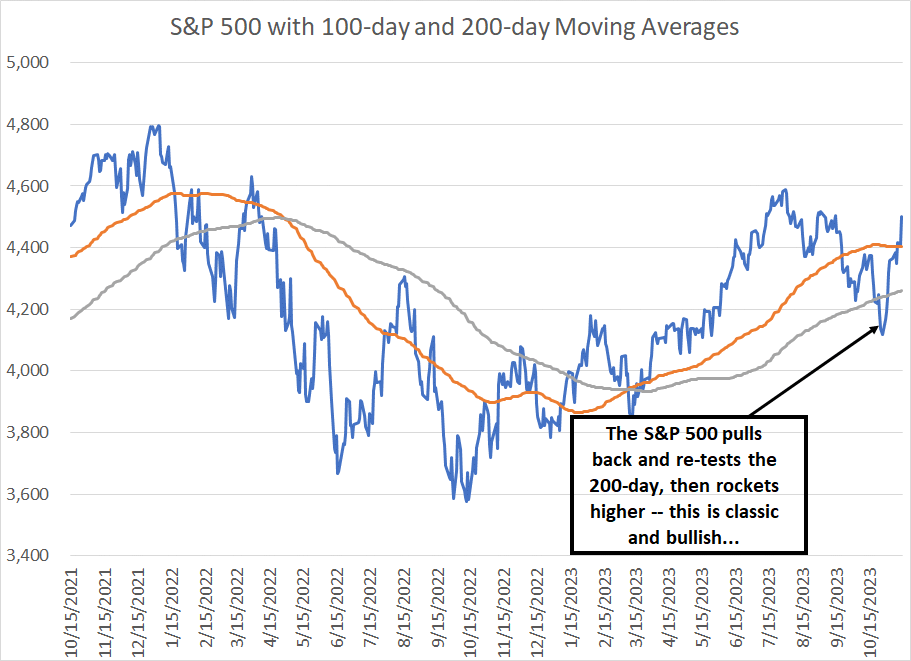
The technical picture increasingly backs that tactical bullish view:
Source: Bloomberg
As I’ve written before, the 100-day and 200-day simple moving averages are key levels to watch for the S&P 500 and other major indices.
It’s not uncommon for the S&P 500 to break below the 200-day in the short-run, as technical support should be viewed as a range not an absolute level. Indeed, during rallies a retest and temporary break below a rising 200-day moving average, followed by a recovery back over the 200-day, is a classic bullish reversal signal for the stock market at least in the short run.
This all suggests there’s more upside to come into year-end and that the reckoning for stocks is likely a 2024 phenomenon.
DISCLAIMER: This article is not investment advice and represents the opinions of its author, Elliott Gue. The Free Market Speculator is NOT a securities broker/dealer or an investment advisor. You are responsible for your own investment decisions. All information contained in our newsletters and posts should be independently verified with the companies mentioned, and readers should always conduct their own research and due diligence and consider obtaining professional advice before making any investment decision.