

Forget the Fundamentals (for Now)
Forget the Fundamentals (for Now)
How to gauge investor sentiment and positioning

The economic and market fundamentals I’ve written about over the past two weeks — see The Bear in Hibernation and Higher for Longer — will eventually drive the next leg of the bear market, and I continue to target the 3,000 to 3,100 level on the S&P 500 this year.
However, in the short-term, fundamentals don’t matter.
Bear market rallies aren’t driven by corporate earnings, economic conditions and interest rates, they’re driven by sentiment and market positioning.
Put in a different way, the current counter-trend rally will likely end only once market participants begin to embrace the bullish thesis and position accordingly.
Unfortunately, sentiment and positioning are notoriously difficult to measure with any degree of accuracy or reliability, particularly in real time.
In past issues, I’ve highlighted several indicators and indices that can help us assess sentiment.
Today, let’s look at two more starting with this:
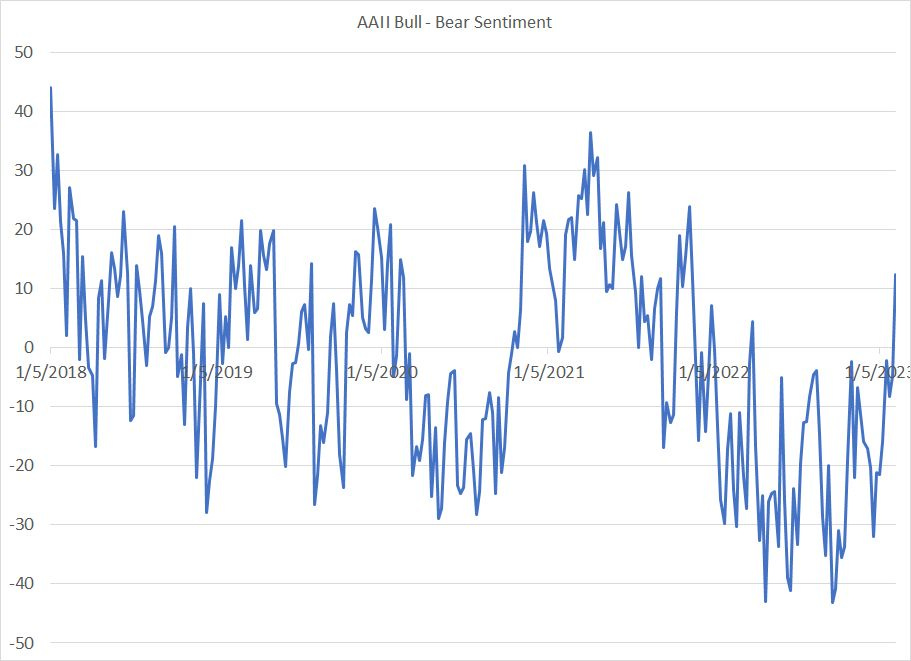
Source: Bloomberg
This data is based on a survey conducted by the American Association of Individual Investors (AAII) asking individuals about their outlook for the stock market over the next six months. Positive readings on this basis indicate that bulls outnumber bears and vice versa.
This indicator doesn’t offer precise timing by any stretch of the imagination. However, you can see that when investors are “bulled up” such as in early 2018 and the second half of 2021, the market is often near a top.
Similarly, when sentiment is very negative, such as last autumn, markets are due at least a near-term bounce.
I believe this survey is best considered in context – during bear markets (downtrends), individual investors will usually remain fairly negative overall and even extreme negative readings don’t necessarily result in much upside. However, during countertrend bounces amid downtrends, by the time the bulls start to dominate the AAII survey the rally is likely long in the tooth.
A classic example: the last time the bulls outnumbered bears in the AAII survey was March 2022, just before the S&P 500 embarked on a new leg lower.
Just this past week, bulls once again outnumbered bears in the AAII survey though the current reading is far from extreme bullish.
Here’s another point to watch:
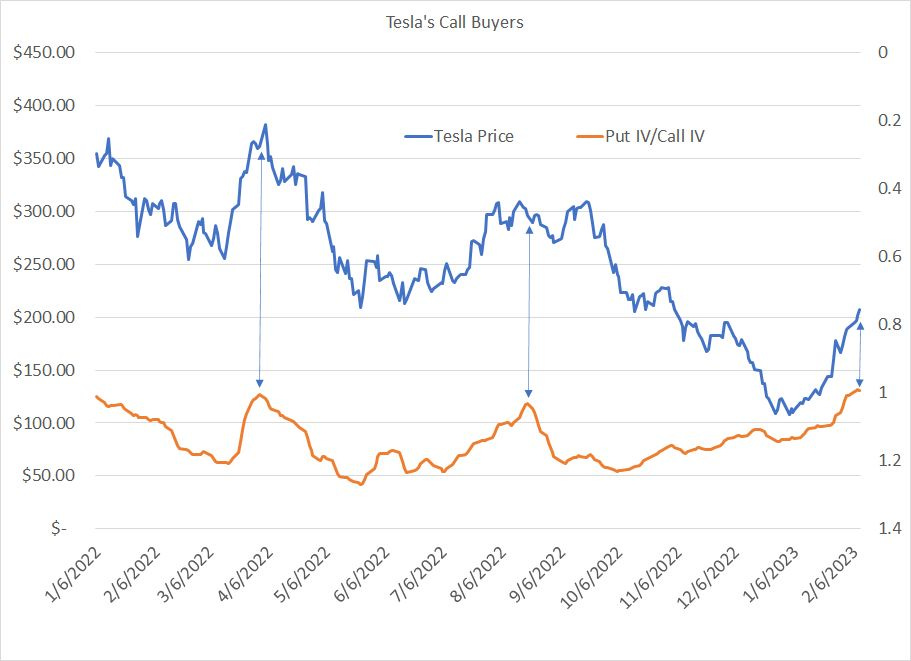
Source: Bloomberg
The blue line on this chart represents the closing price of Tesla (NSDQ: TSLA) since early 2022 (left-hand scale).
The orange line is a little more complex. This represents the implied volatility priced into out-of-the-money put options on Tesla with roughly 30 days until expiration divided by the implied volatility on call options of a similar description.
To be more accurate, I’m comparing implied volatility on calls with a delta of 0.25 and puts with a delta of -0.25 (out of the money puts and calls).
Tesla has been one of the large-cap market leaders this year, roughly doubling in price from the low of $108.10 on January 3rd to Wednesday’s close of $214.24. It’s also been consistently the single most active stock (not ETF) for options traders this year with many speculators using short-term call options to speculate on upside in TSLA shares.
In most market environments I’d expect put options to have a higher implied volatility than call options with a similar delta. The reason is that investors buy puts as an insurance policy against market or stock-specific downside risks (a hedge).
When call options get expensive (implied volatility spikes) that can indicate a spike in speculative bets on further upside in TSLA stock, a sign of rising bullish market sentiment and risk of a near-term top.
As you can see on my chart, spikes below 1.0 on this indicator (I’ve inverted the scale) have been consistent with near-term peaks in Tesla stock since early 2022. This indicator is far from perfect, but it does seem to suggest that sentiment is no longer bearish on some of this year’s big winners and the recent rally could be due for a rest or correction.
As I said in last week’s issue, the short-term trend for markets is higher and that must be respected:
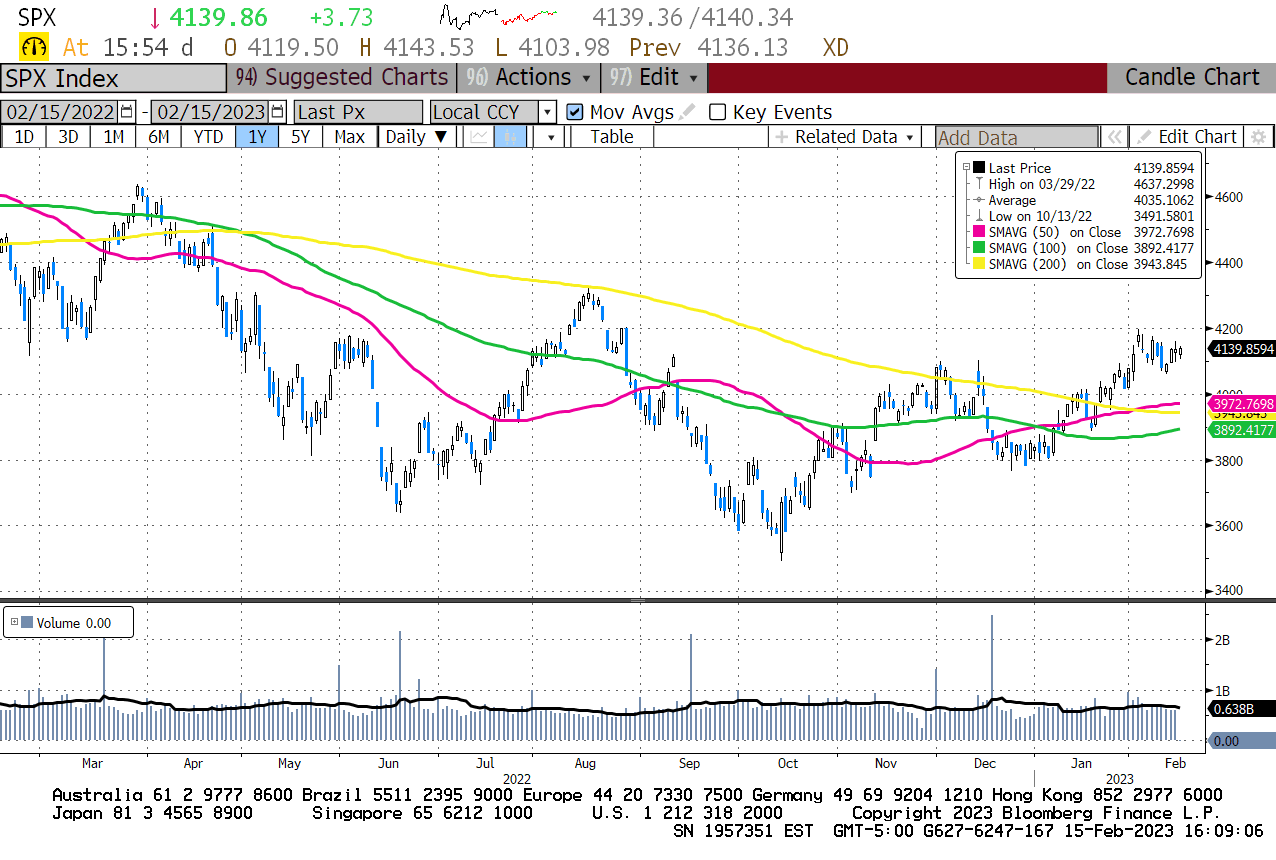
Source: Bloomberg
As this chart shows, the S&P 500 has pulled back only slightly since February 2nd and remains above several key support levels in the 3,900 to 4,000 level and, until that changes, the bias will remain for further upside in this bear market rally.
Just remember, there’s a strong tendency for dip buyers to jump in on the first modest pullbacks in a rally.
However, we are beginning to see the first signs of fatigue in the broader market as sentiment has improved from very bearish positioning at the end of last year and high-beta names like Tesla are looking stretched and overbought on the charts.
I continue to look for this market to trend higher near-term; however, I fully expect we’ll be starting the next leg of the bear market in the next 1 to 2 months.
DISCLAIMER: This article is not investment advice and represents the opinions of its author, Elliott Gue. The Free Market Speculator is NOT a securities broker/dealer or an investment advisor. You are responsible for your own investment decisions. All information contained in our newsletters and posts should be independently verified with the companies mentioned, and readers should always conduct their own research and due diligence and consider obtaining professional advice before making any investment decision.