

Free Cash Flow, Market Returns and Quantitative Easing
Free Cash Flow, Market Returns and Quantitative Easing
The new market leaders...

Last week, I wrote about the dominance of Tech+ stocks since the Global Financial Crisis and Great Recession of 2007-09 in Are Energy Stocks Overvalued?
I also wrote about how Tech+ hegemony of the past 15 years is starting to crumble and what it means for market leadership, and overall stock market returns, over the next 5 to 10 years.
There’s no single perfect explanation for what drove Tech+ dominance; however, it’s pretty clear ultra-low interest rates and quantitative easing played a major role.
Take a look at this table:
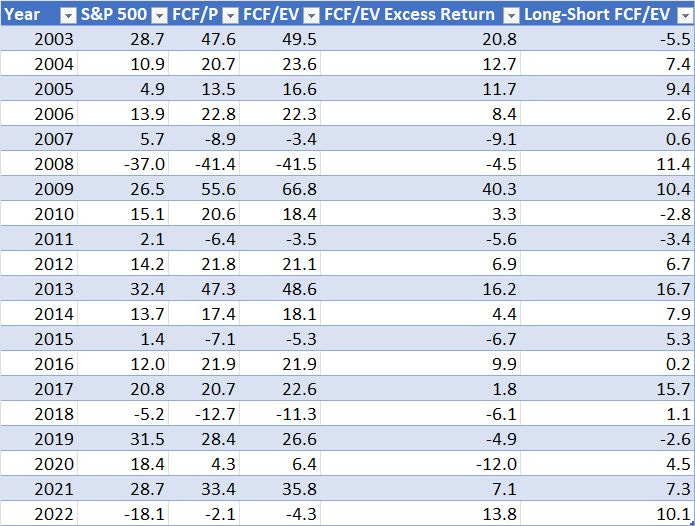
Source: Bloomberg
Stocks that generate strong free cash flow (FCF) tend to outperform the broader stock market.
Over the 20-year period from year-end 2002 through year-end 2022, a strategy of buying the top 20% of S&P 500 stocks with the highest free cash flow yield (FCF divided by market capitalization) and rebalancing monthly has generated a total return of 902% compared to the S&P 500 up 547.6%.
Meanwhile, the top quintile of S&P 500 stocks has outperformed the bottom quintile (lowest free cash flow yields) by 113 percentage points.
If we swap enterprise value for market capitalization in the denominator of the equation (FCF/Enterprise Value) returns are even higher with the top quintile of S&P 500 companies up 1,199.8% and the top quintile besting the bottom quintile by almost 165 percentage points.
Enterprise value (EV) is a measure of firm size that accounts for the net debt held by the company as well as the market value (market capitalization) of the shares. Thus, FCF yield using EV penalizes companies with high debt burdens.
My table above shows the performance of these free cash flow strategies broken down by year since 2002. A quick glance reveals the S&P 500 only outperforms FCF-based stock selection for a handful of periods over the past 20 years such as 2007-08, 2010-11, 2015 and 2018-2020.
It’s no accident these happen to be periods where the Fed started easing aggressively in response to economic weakness and pressure in the financial markets. Indeed, the worst year for FCF as a fundamental factor in the past 20 years was 2020 when the S&P 500 outperformed by 12 percentage points; of course, 2020 was also the year of “Big Bang” coordinated fiscal and monetary stimulus when the S&P 500 Information Technology Index soared 43.6%, besting the S&P 500 by 25.2 percentage points.
Here's a different way of looking at this phenomenon:
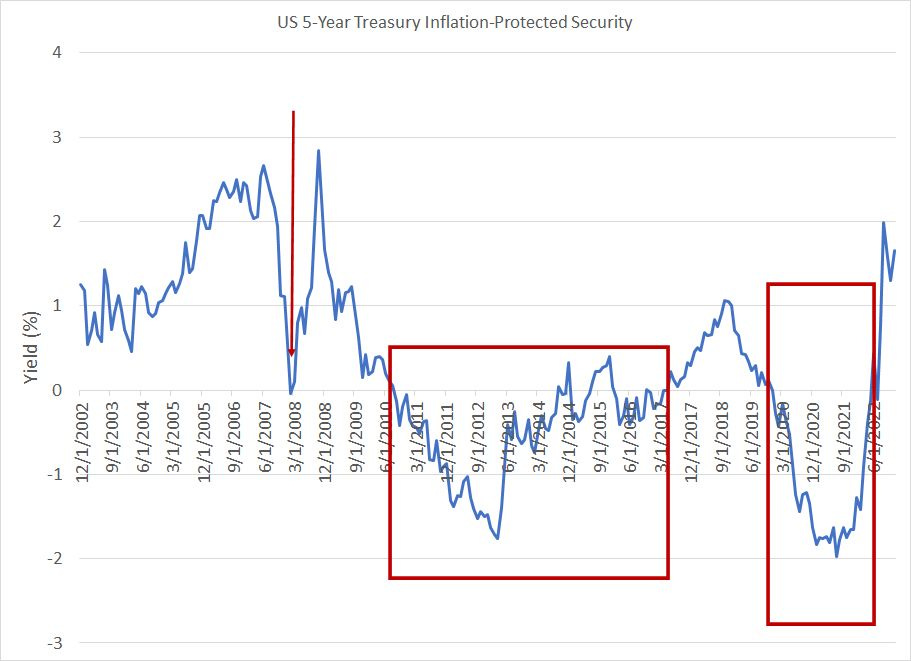
Source: Bloomberg
This chart shows the yield on 5-Year Treasury Inflation-Protected Securities (TIPS), bonds issued by the US government that compensate investors for inflation. The yield on TIPs represents the level of real US interest rates (interest rates adjusted for inflation).
In other words, if nominal rates are at 4% and inflation is running 5% annualized, the real yield would be negative, because borrowers are paying back loans using dollars of reduced purchasing power.
I’ve boxed, or indicated with a red arrow, periods of negative real interest rates in the US since 2002 –these periods correspond roughly to episodes of severe underperformance for free cash flow based valuation metrics.
That’s logical – if cash is free, then why would investors pay up for companies that generate a great deal of free cash flow?
Put in a different way, negative real interest rates weaken – even repeal – what’s arguably the most basic law in finance, the time value of money. The simple (and logical) idea that $10 in 10 years’ time is worth less than $10 today starts to shred, meaning distant future earnings prospects are worth nearly as much as money earned in the current fiscal year.
For most of history, real interest rates have been positive—persistent negative real interest rates in the US and other developed economies is largely a modern phenomenon, the consequence of extraordinary monetary stimulus in the years following the financial crisis of 2007-09. That’s why free cash flow factors have tended to beat the market – profitable companies that generate cash beat less profitable companies – for much of financial history but have been less reliable since 2007-09.
Of course, the surge in inflation to 40-year highs over the past two years has forced the Fed to, at a minimum, boost real rates back to positive territory. If the economy tips into recession later this year as we expect, it’s likely to Fed would take a pause on rate hikes and, ultimately, cut interest rates as it switches to an easing bias.
However, the experience of the past 3 years underlines the danger of prolonged, overly accommodative monetary policy – I suspect the era of consistently negative real rates has passed. Moreover, overly aggressive monetary easing would undoubtedly reignite the economy and inflationary pressures, limiting the Fed’s ability to conduct “preemptive strikes” on market weakness as they did in late 2018-early 2019 and again in early 2020.
As such, we suspect that free cash flow will regain its power as a fundamental factor and valuation tool that it maintained in most economic and market environments. That’s certainly been the case over the 13 months since the end of 2021.
This is NOT good news for the S&P 500 though energy stocks, and some other sectors, should benefit:

Source: Bloomberg
Note that the higher the free cash flow yield offered by a particular sector, the more attractive (cheaper) the valuation on this basis. And, as you can see, whether you measure it on a FCF/Price or FCF/EV basis, sectors like Technology and Consumer Discretionary that have come to dominate the market in recent years look expensive.
Meanwhile, energy is a standout on this basis with the highest free cash flow yields on our table.
What’s particularly dangerous is that most heavily weighted stocks in the S&P 500 are also among the most expensive on a free cash flow yield basis despite sizable stock price declines over the past year. For example, Amazon.Com currently generates a negative free cash flow yield, while Microsoft’s yield of 3.33% is below the long-term average of 5.33% (based on data since January 1990).
And take a look at the largest energy stock in the S&P 500:

Source: Bloomberg
As you can see, Exxon Mobil (NYSE: XOM) currently offers a free cash flow yield of near 12.8% compared to a post-1995 average of just over 5%.
Based on XOM’s annual free cash flow in the $60 billion range, a free cash flow yield of 5%, in line with the long-term average, would imply a market the stock trades well above $250 compared to $117 currently.
In short, while Exxon has performed well over the past year, the stock isn’t expensive and even a return to a mid-cycle valuation for XOM could imply upside in the stock more than 100% over the next few years.
Passive Aggressive
In the past 20 years, passive investment strategies – exchange traded funds (ETFs) in particular -- have come to dominate the US investment landscape:

Source: Bloomberg
In early 2012 exchange traded funds (ETFs) accounted for just over 16% total assets under management (AUM) in equity (stock) funds – mutual funds still dominated. In just over a decade, that’s doubled to roughly a third of total AUMs.
Even more impressive, passive (indexing) strategies accounted for less than 31% of all assets invested equity ETF and mutual fund assets a decade ago, compared to nearly 55% today.
At the end of September 2022, $4.52 trillion was invested in passive equity ETFs alone.
Think about that: Most investors don’t invest in stocks these days, they invest in indexes like the S&P 500 or the Nasdaq 100, often by simply buying an ETF like the SPDR S&P 500 Trust (NYSE: SPY).
Of course, there’s nothing wrong with ETFs or passive indexing strategies. And there’s a certain logic to the strategy -- if you buy SPY, you’re buying a share of 500 stocks, achieving broad diversification with a few clicks of the mouse.
However, the increased dominance of a handful of growth stocks in the S&P 500 and the rise of passive strategies represent a troubling trend. Just consider that when you’re buying a “diversified” ETF like SPY, what’s you’re really buying is a huge overweight in a handful of growth stocks as I outlined in last week’s issue.
More than $380 billion worth of Apple Inc. (NSDQ: AAPL) shares – about 16.5% of the total shares outstanding -- are held in passive ETFs and Mutual funds. In contrast, pension funds only own 3.3% of the stock, hedge funds just over 1%, individuals 0.10% directly and, through brokerages, 2.31%.
For Microsoft (NSDQ: MSFT), it’s 18.31% passive, 3.5% through pension funds, 2.53% through brokerages and less that 0.07% individuals.
Out of every $100 invested in “SPY” alone, more than $25 is actually invested in just 10 stocks. Meanwhile, the amounted invested in the 12 top stocks in the S&P is slightly more than the bottom 400 stocks in the index combined.
Simply put, assets invested in “diversified” passive ETFs and Mutual funds represent a concentrated and aggressive overweight in some of the most expensive stocks in the S&P 500, mainly in the technology and consumer discretionary sectors.
This multi-trillion-dollar Passive/ETF monolith was all well and good during the bull market of the past 13 years, where ultra-low rates and QE drove ever-rising valuations for the Tech+ contingent and rising stock market wealth.
However, amid the valuation and economic imbalances we’ve just outlined, this same phenomenon represents a broader market risk and overhang – the concentration of passive investment assets in vulnerable growth and tech themes would lead to years of consistent poor performance. That, in turn, could easily prompt ETF sales and passive fund redemptions that further serve to depress equity market returns.
We see overlooked and underappreciated groups like energy as a key beneficiary of these shifts and less vulnerable to index and ETF-driven selling pressure.
DISCLAIMER: This article is not investment advice and represents the opinions of its author, Elliott Gue. The Free Market Speculator is NOT a securities broker/dealer or an investment advisor. You are responsible for your own investment decisions. All information contained in our newsletters and posts should be independently verified with the companies mentioned, and readers should always conduct their own research and due diligence and consider obtaining professional advice before making any investment decision.