

Odd Jobs
Odd Jobs
More mixed messages from an overrated economic release

Long-time readers know of my reservations regarding the monthly Employment Report released by the Bureau of Labor Statistics (BLS) on the first Friday of every month. Most recently, I covered this report in “About that Employment Report” back in January.
Economic data seems to go through trends in popularity over time. For example, five years ago the monthly Consumer Price Index (CPI) release wasn’t widely watched and, in most cases, didn’t really move the needle for stocks or bonds. Of course, the surge in inflation and the Fed’s response to that jump have rendered CPI arguably the most widely watched economic report each month over the past year.
Then there’s the Fed’s weekly H.4 and H.8 releases showing the condition of the Fed’s balance sheet and the balance sheets for US commercial banks respectively. For years few watched these releases then as the Fed unveiled QE amid the financial crisis some 15 years ago, many started to watch the H.4 report as a proxy for Fed bond-buying activity.
And, for less than two months now, the H.8 report has been a star as a means of assessing the degree of deposit flight from US regional and local banks and the consequent tightening in lending standards and activity.
However, through all these episodes, and regardless of the condition of the US economy, the monthly jobs report has been consistently considered a marquee economic release.
Of course, the labor market sits at the core of the US economy and drives consumer spending. The problem remains this particular release is subject to massive subsequent revisions that can completely change the picture for the economy.
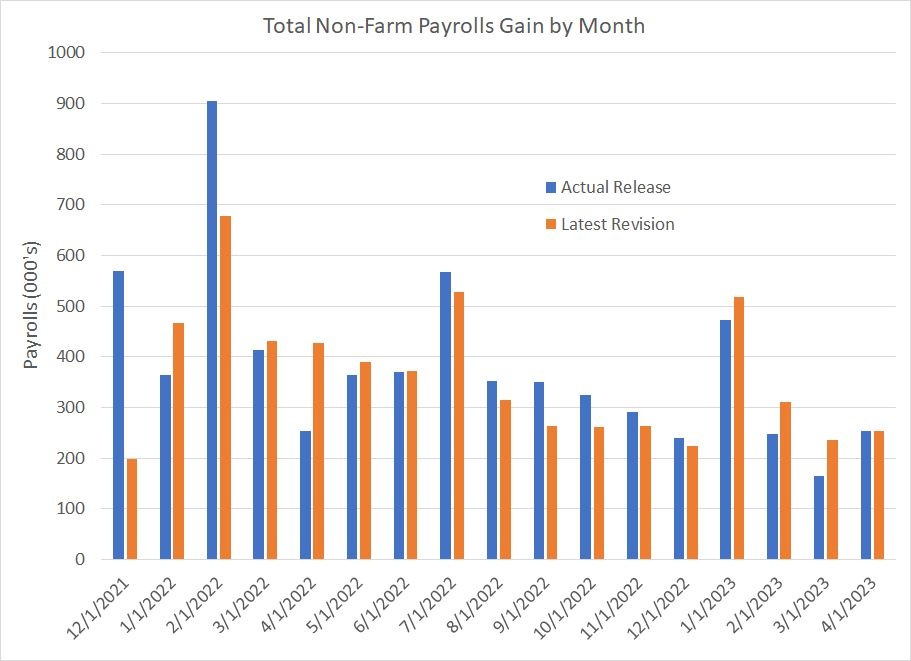
Friday’s release, showing the US created a much better-than-expected 253,000 jobs last month, offers a convenient example:
Source: Bloomberg
This chart shows the initial BLS estimate for the change in US payrolls in blue and the latest revision in orange since December 2021.
Of course, you can see the massive downward revisions to months like December 2021 and February 2022. For the most part these revisions are made as part of an annual benchmark revision BLS releases in February of each year.
However, BLS also conducts revisions to each monthly release in subsequent months. For example, as part of this month’s release of April jobs, BLS revised data for the past two months – February and March 2023 – lower by a combined 149,000 payrolls.
Let’s put that into perspective.
First, the consensus on Wall Street ahead of Friday’s release was for the US to add 185,000 non-farm payrolls in April; yet BLS tells us the US added 253,000 jobs, a “beat” of 68,000 payrolls.
However, simultaneously, BLS tells us they over-estimated payrolls from February and March by 149,000 jobs, so if we adjust that 253,000 jobs number accordingly, today’s data looks much softer than expected.
Second, let’s re-examine the past two months.
Back on March 10th, when BLS announced the February jobs data, Wall Street was expecting +215,000 jobs and BLS reported +311,000, much stronger than expected. As a result of that strong number, some began to speculate the Fed might be forced to raise rates by 50 basis points at their March 21-22 meeting. The latest revision for February is 248,000 payrolls, close to the market’s initial estimate two months ago.
Last month, BLS announced data for March on Friday April 7th. Wall Street was looking for +230,000 and BLS reported +236,000, so pretty much in-line. However, the latest revision to last month’s data comes in at just +165,000, a number that likely would have been considered a significant miss relative to expectations had it been released in real time.
And, lest we forget, according to BLS itself the 90% confidence interval on its monthly payrolls estimates is +/- 130,000 payrolls. So, while markets could usually be expected to react with force to a monthly number that’s 75,000 to 100,000 more than expected, the reality is that even a beat of that magnitude could represent little more than statistical noise.
Put in a different way, today’s payrolls “beat” of 68,000 is well within that +/130,000 margin of error; I wouldn’t be surprised to see April jobs revised sharply lower over the next two months.
Two more points to keep in mind.
First, the monthly employment release includes data from two different surveys, the so-called “household” survey of about 60,000 households in the US, and the “establishment” survey of 122,000 businesses. However, as we all know, just because you receive a survey in the mail or electronically doesn’t mean you’re going to immediately sit down and fill it out.
Since 2020, the number of businesses that respond in timely fashion to the monthly establishment survey has fallen dramatically:

Source: Bloomberg
As you can see, the response rate to the BLS Establishment Survey was reasonably steady around 60% from 1999 through to the end of 2019, then collapsed in 2020.
I suppose the initial collapse in 2020-21 is understandable. After all, if the government forces you to close your business or encourages work from home then, particularly for small and mid-sized businesses, you might not get around to responding.
However, you would think the response rate would recover towards the long-term mean in that 55% to 65% region as the initial coronavirus panic waned. That just hasn’t happened and recently the response rate appears to be drifting lower. As of December 2022, the last month for which BLS provides data, the response rate stood at 43.9% compared to about 46% in early 2022.
Much as with political polls, the fewer responses you get from a survey, the smaller your sample relative to the actual population you’re attempting to estimate, then the less reliable your output. There’s no way to know how BLS is dealing with this, but I suspect they’re likely relying on various models and estimation techniques that could reduce the accuracy of the monthly numbers relative to what we saw prior to 2020.
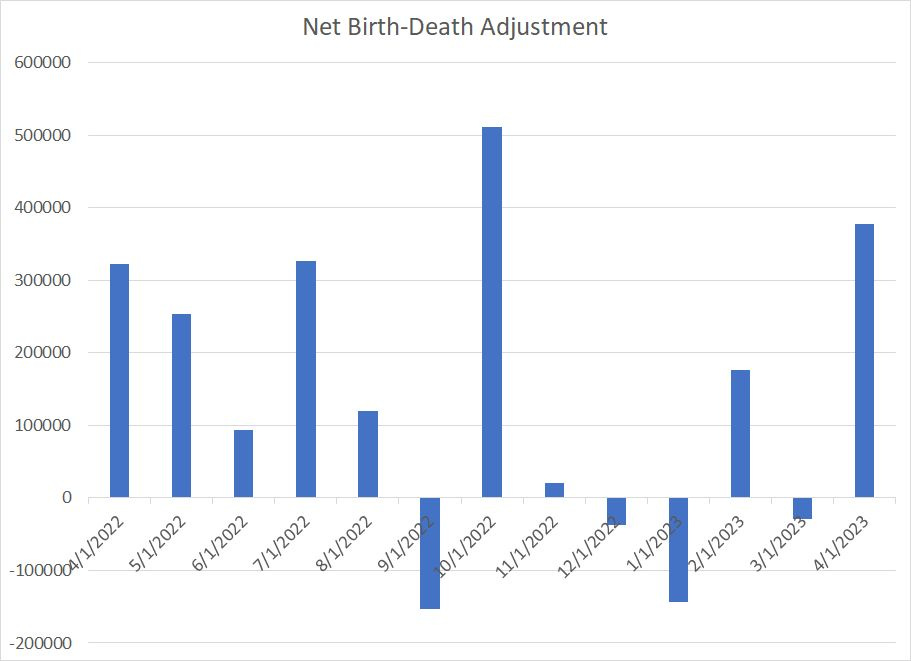
One example of that is the ominous-sounding “CES Net Birth-Death Model.”
Basically, the idea is that each month new businesses are created in the US and these businesses hire new workers – these are business births. However, BLS has found that it takes time for a new business to show up on the government’s radar screen and become available for survey sampling. The same thing on the other side of the coin – when a business stops operating or “dies” to use the BLS terminology that can account for significant payrolls losses each month.
BLS uses some standard techniques to estimate the impact of business births and deaths each month, but in the month of April alone BLS added 378,000 jobs to its estimates based on this model. That’s a huge number and it’s among the larger birth-death adjustments since the beginning of last year:
Source: Bureau of Labor Statistics
The truth is that economic data rarely paints a completely consistent picture of the economy, which is why it’s best to examine a broad array of proven indicators, ignore the day-to-day and week-to-week narratives, and focus on the trends.
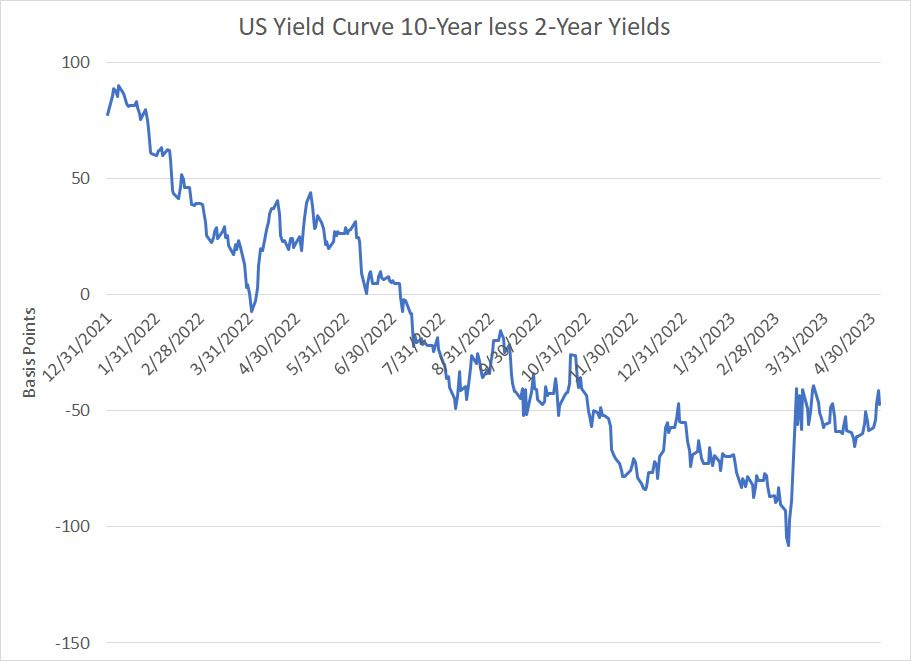
My conclusion remains we continue to see a steady deterioration in underlying economic fundamentals that will lead to recession by Q3 of this year. If I were forced to pick one chart to monitor, it would probably be this one:
Source: Bloomberg
This chart shows the yield on 10-year Treasuries less the yield on 2-Year Treasuries; it’s a common definition of the slope of the yield.
As I explained in “Accidents, the Yield Curve and Recession,” this version of the yield curve has traditionally inverted (negative number on my chart) months ahead of the start of the US recession. Then, in modern cycles, it typically steepens rapidly to regain a positive slope when the recession is imminent.
In fundamental terms, the inversion represents tight monetary policy, and the rapid re-steepening represents growing expectations for Fed rate cuts to address spreading economic weakness.
Yesterday, the curve re-steepened to the highest levels this year. We’re not positive yet, but if we see this curve pop above 0, and particularly above +50 basis points, then that’s a signal the economic outlook is souring fast.
DISCLAIMER: This article is not investment advice and represents the opinions of its author, Elliott Gue. The Free Market Speculator is NOT a securities broker/dealer or an investment advisor. You are responsible for your own investment decisions. All information contained in our newsletters and posts should be independently verified with the companies mentioned, and readers should always conduct their own research and due diligence and consider obtaining professional advice before making any investment decision.