

OPEC Cuts, Recession and Oil Prices
OPEC Cuts, Recession and Oil Prices
5 Key Factors to Consider

On Sunday April 2nd, The Organization of the Petroleum Exporting Countries (OPEC) announced a voluntary oil production cut of 1.66 million bbl/day starting in May 2023, through (at least) the end of this year.
The prices of Brent and WTI crude oil both jumped over 6% in Monday’s session on the news and have held most of those gains over the past two days:
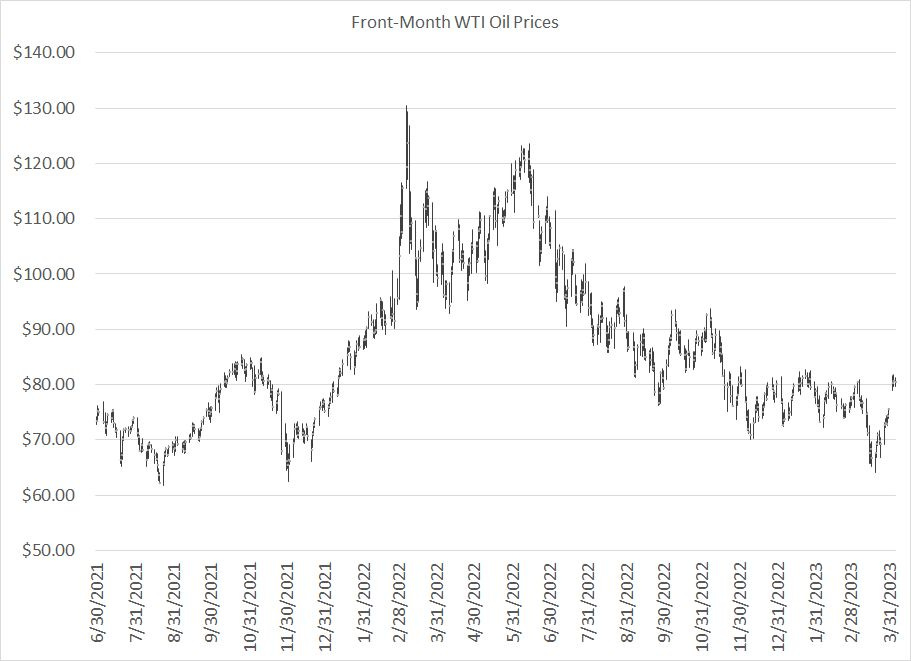
Source: Bloomberg
Several readers have asked for my thoughts on OPEC’s latest move and what it means for oil prices and energy stocks, so here are 5 key takeaways:
OPEC Took Advantage of Market Positioning
In the March 28, 2023 issue of The Free Market Speculator “Oil Bears Everywhere,” I took a closer look at the weekly Commitment of Traders report for the Brent and WTI oil futures markets.
In short, at one point last month speculators’ net long position in WTI and Brent futures market was a full two standard deviations below the 3-year (156-week) moving average. Historically when speculators are that bearish crude, oil prices are due at least a short-term rally.
A surge in the gross short position over the past month means some hedge funds had amassed large bearish positions in crude, betting on further downside in prices:
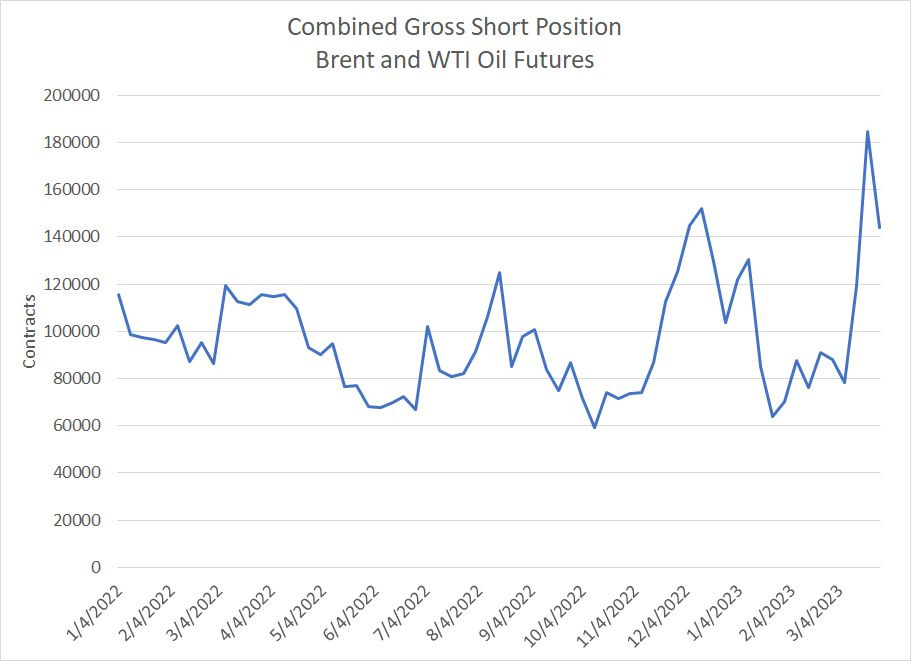
Source: Bloomberg
This chart shows the gross short position for speculators in both the Brent and WTI futures market since the end of 2021. This is the gross short position in isolation rather than the net position I wrote about in last week’s issue.
On March 21, 2023 speculators were short a combined 184,652 contracts. That represents futures and options contracts covering more than 184 million barrels of Brent and WTI crude oil.
The data released on Friday March 31st, covering futures market positioning as of the 28th, reveals speculators covered some of those short positions before last weekend’s OPEC meeting. Still, the gross short position was a combined 143.8 million barrels, near the highs of the range since the beginning of last year.
When OPEC cuts production and traders are already heavily long, you’ll often see the move fade quickly; in this case, the gap higher in prices sent shorts scrambling to cover their positions, magnifying the impact of the news.
That’s also why OPEC’s move wasn’t as much of a shock as some in the financial media suggested – the future market positioning data is released every week for all to see, and when oil futures market positioning data gets that extreme it’s like an engraved invitation for the cartel to act.
There’s a Recession Ahead
OPEC published its monthly oil market report on March 14th showing a steady ramp in demand for OPEC oil into the second half of this year:

Source: OPEC Monthly Oil Market Report March 2023
The call on OPEC is defined as total world oil demand less total non-OPEC liquids production as well as OPEC-produced natural gas liquids (NGLs). It’s essentially the amount of oil the world needs from OPEC to prevent a drawdown in oil inventories.
If OPEC supplies more than the call on OPEC, global oil inventories will expand, putting pressure on prices and vice versa.
OPEC sees the call on OPEC rising to more than 30 million bbl/day by Q4 this year mainly due to an increase in demand — their estimates anticipate demand rising from 101.1 million bbl/day in Q4 2022 to 103.39 million in Q4 2023, implying year-over-year growth of almost 2.3 million bbl/day. While they also project non-OPEC production will rise, the increase isn’t sufficient to meet demand without more oil from OPEC.
Since OPEC oil production is currently around 29 million barrels per day and they’d intended to keep output flat near that level, per OPEC’s own estimates you could expect to see sizable drawdowns in global oil inventories by Q3/Q4 and some support for prices.
As I mentioned this monthly oil report was published on March 14th, before OPEC announced a move to further cut production last weekend.
Reading between the lines, this strongly suggests OPEC has some concerns about their projections for a tighter oil market in the second half. More specifically, I suspect they have some concerns global oil demand growth might be lower than their official estimates or, at a minimum, there’s downside risk to those estimates.
In a sense this cut could be seen as an insurance policy to address risk demand is lower-than-expected amid a global economic downturn (recession), which would tend to put pressure on oil prices.
And since OPEC — especially Saudi Arabia -- has unparalleled insight into actual supply and demand conditions on the ground, investors should heed this warning shot and consider that, quite likely, the global economy is weakening a good deal faster than placid trading in equity markets year-to-date might suggest.
Regardless, recession looks likely given what we’re seeing in the yield curve as I wrote right here as well as in releases like this month’s ISM Manufacturing PMI.
OPEC sees the March Lows as a Key Support Level
Yes, factors such as speculative short positions in the futures market likely influenced OPEC’s timing for this cut.
However, the break below the $70/bbl level on WTI and $75/bbl on Brent in mid-March represent the lowest trading levels for these benchmarks since late 2021. At a minimum, this suggests OPEC is uncomfortable with oil prices below $65 to $70 for WTI and $70 to $75 for Brent.
Longer term, I also suspect prices below these levels would be insufficient to encourage the level of capital spending needed across global oil markets to meet the world’s rising demand.
Typically, oil prices do see a correction during recessions driven, in part, by weaker global oil demand growth.
Take a look:

Source: BP Statistical Review of World Energy 2021
This chart shows annual oil demand growth from 1985 through 2018; I’ve divided the bars to show demand growth (declines) for developed OECD countries and developing non-OECD countries. The black arrow and the two black boxes correspond to US recessions; in all three instances, the European Union and most other developed countries also experienced economic downturns in this years.
Typically, recessions do catalyze a decline in global oil consumption growth, though not always an outright decline in global demand.
Three points to note.
First, the level of demand destruction in milder recessions like 1990-91 and 2001 is less severe than in major recessions such as 2007-09.
Second, since the 1990s non-OECD demand has been more resilient and less cyclical than developed world demand. That’s because oil demand growth in countries like China and India is a consequence of their rapid economic growth and development — a secular increase in consumption of oil per capita — rather than cyclical factors.
So, in 2007-09, for example, we saw a sizable decline in developed word demand (blue bars) offset in part by growth in developing countries.
Third, once the recession is over, global oil demand tends to bounce back and you’ll see a few years of elevated growth coming out of the downturn. That’s clearly visible in 2011 as well as in 2003-04 and 1994-97.
Falling global oil demand growth tends to put temporary pressure on prices:

Source: Bloomberg
Oil prices pulled back about 50% from their peak in 2000 through the lows in late 2001. Note that oil prices bottomed about a year before the S&P 500 in this cycle and then more than doubled from their 2001 lows by the latter half of 2002, continuing to over $50/bbl by late 2004.
This illustrates a key point about the oil market: Demand-led pullbacks in oil can be sizable but tend to be short-lived. It’s the supply side of the equation that drives the big supercycles such as rising oil prices in the 1970s and from 1998-2014 and falling oil prices from 2014 through much of 2020.
In recessions like 2001 where there’s a demand hit but the supply picture remains bullish, oil tends to see explosive rallies coming out of the downturn.
Also note that when OPEC is in the driver’s seat for the oil market, as is the case today, the cartel often starts cutting production as the global economy enters recession:
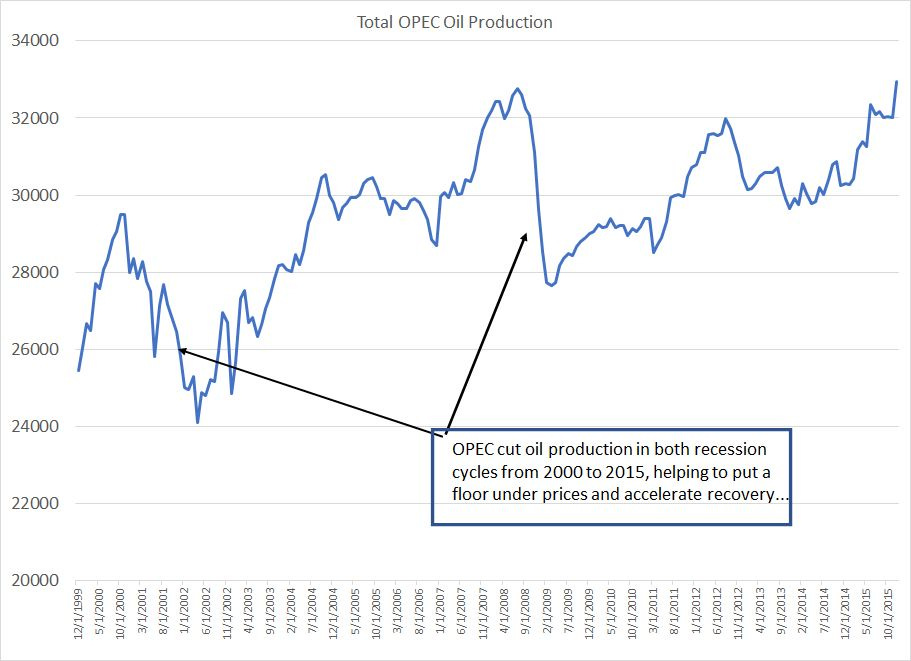
Source: Bloomberg
As you can see, OPEC cut production dramatically in 2000-01 and in 2008-09 as the global economy entered recession. This helped forestall a rise in global oil inventories as demand growth waned, put a floor under prices and encouraged the subsequent recovery.
It appears they’re doing exactly the same thing this cycle with production cuts announced late last year and last weekend.
The correction from last year’s peak to recent lows is roughly similar in scale to what we saw back during the 2001 recession cycle and OPEC’s move suggests they’d like to keep a floor under oil prices as I just noted.
This suggests the downside for crude below recent lows is limited unless the recession turns out to be far deeper than expected (more like 2007-09 than 2001 of 1990-91).
OPEC Did This Because It Could
As I explained in “Why Oil Supercycles End,” spending on global oil exploration and development has collapsed since the peak in 2013-14 and hasn’t recovered much, especially outside OPEC, even as oil prices soared in 2021-22.
There are multiple factors behind this including low commodity prices for much of the 2015-2020 period, poor/counterproductive government policy in the US and Europe discouraging new investment, ultra-low interest rates which drove capital spending in tech/growth sectors at the expense of energy and (in my opinion) the distorting impact of climate and ESG factors in financial management decision-making.
Regardless, the result has been OPEC and its allies now control a larger portion of the world’s supply of fossil fuels, and possess virtually all the world’s true spare capacity, giving them the ability to control prices effectively.
This represents a major shift in global oil market power since 2012-2020, when the rise of US shale production acted as a check on OPEC’s power.
Actual Cuts Less than Headline but There’s Room for More
Most of the headlines in the mainstream and financial media about OPEC are just plain wrong.
While the headlines claim OPEC is cutting 1.66 million bbl/day the reality is more like 600,000 to 800,000 bbl/day because some countries announcing voluntary cuts were already underproducing their quotas due to declining output from existing fields.
The key to understanding whether OPEC is serious is to watch what the Saudis do because the Kingdom has a history of following through on announced production adjustments taking real barrels off market – in this case they’re cutting 500,000 bbl/day, which is a large move.
(I’d also pay attention to the large cuts from UAE at 144,000 bbl/day and Kuwait at 128,000 bbl/day.)
Also note that even after a cut of 500,000 bbl/day, Saudi output will remain in the 9.8+ million bbl/day range, which is close to the 10-year average production level for the country:
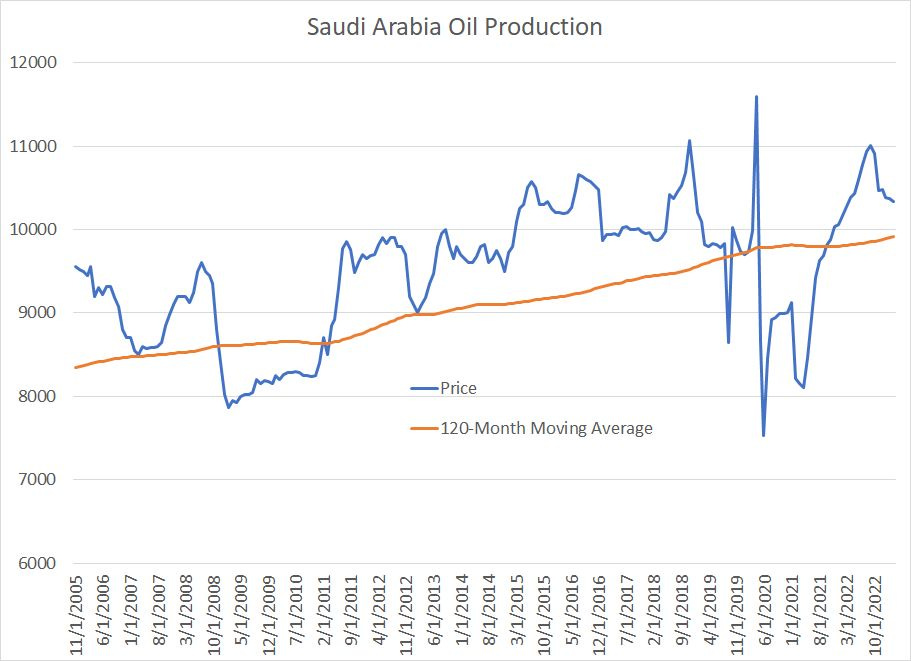
Source: Bloomberg
Over the years, Saudi has proved willing to cut production much deeper than that – perhaps down to 8 to 8.5 million bbl/day – if needed to support prices through a recession.
Thus, if prices don’t firm up or there are further signs of weakening demand, don’t be surprised if OEPC announces further adjustments. The probability of further action would increase should weekly futures market commitments show signs of speculators increasing short positions.
The bottom line is there remains downside risk for oil prices near-term as a likely recession comes into view. However, downside is limited to recent lows and I see oil prices generally remaining in a healthy range for most high quality producers.
Simply put, we’re likely seeing a short correction cycle in oil within a longer-term bullish supercycle driven by the tight global supply outlook.
DISCLAIMER: This article is not investment advice and represents the opinions of its author, Elliott Gue. The Free Market Speculator is NOT a securities broker/dealer or an investment advisor. You are responsible for your own investment decisions. All information contained in our newsletters and posts should be independently verified with the companies mentioned, and readers should always conduct their own research and due diligence and consider obtaining professional advice before making any investment decision.