

Party Like it's 1999
Party Like it's 1999
Market breadth is (almost) unprecedented

The S&P 500 broke above its February 2nd peak last week and the Nasdaq 100 is now up a whopping 8.2% over a similar holding period.
However, just underneath the surface, there’s significant, spreading weakness:
Source: Bloomberg
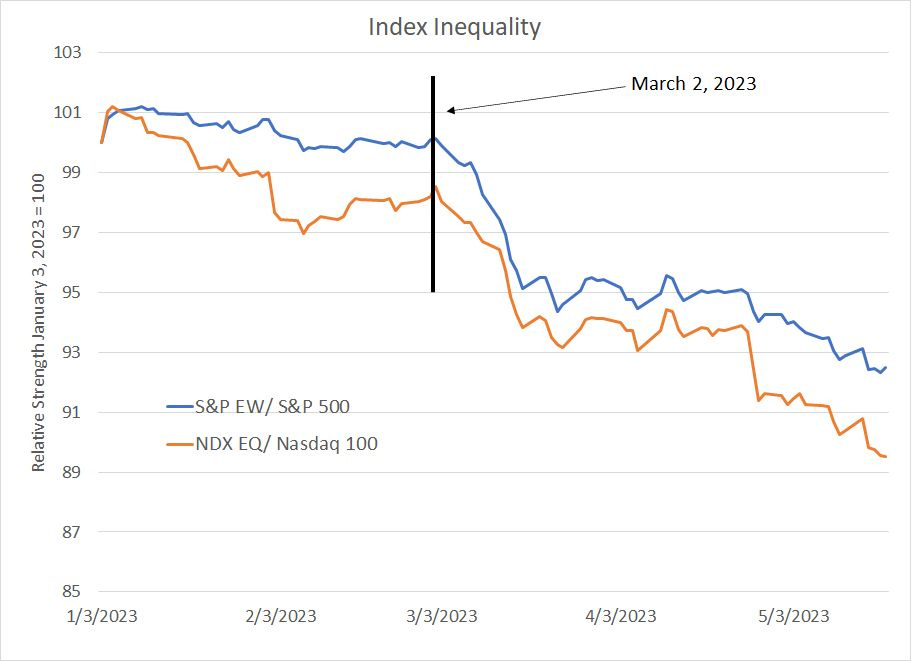
The S&P 500 Equal-Weight Index weights all components in the S&P 500 equally, rather than by market capitalization. The Nasdaq 100 Equal-Weight does the same for the 100 stocks in the Nasdaq 100 Index. This chart shows the relative strength of the S&P 500 (in blue) and Nasdaq 100 (in orange) Equal Weight (EW) indices to their traditional market-cap weighted (MCW) siblings so far this year.
When the market rallies and strength is broad-based, these relative strength lines should rise or, at a minimum, trade broadly sideways.
However, when strength in the indices is driven by just a handful of behemoths with hefty index weights, that shows up in the form of a declining relative strength line on this chart.
As you can see, the equal-weight versions of both benchmarks held up reasonably well through early March and then collapsed. Year-to-date the S&P 500 EW Index is now underperforming the S&P 500 by more than 8 percentage points while the Nasdaq EW is underperforming by a whopping 13 percentage points.
The Worst Breadth in 24 Years
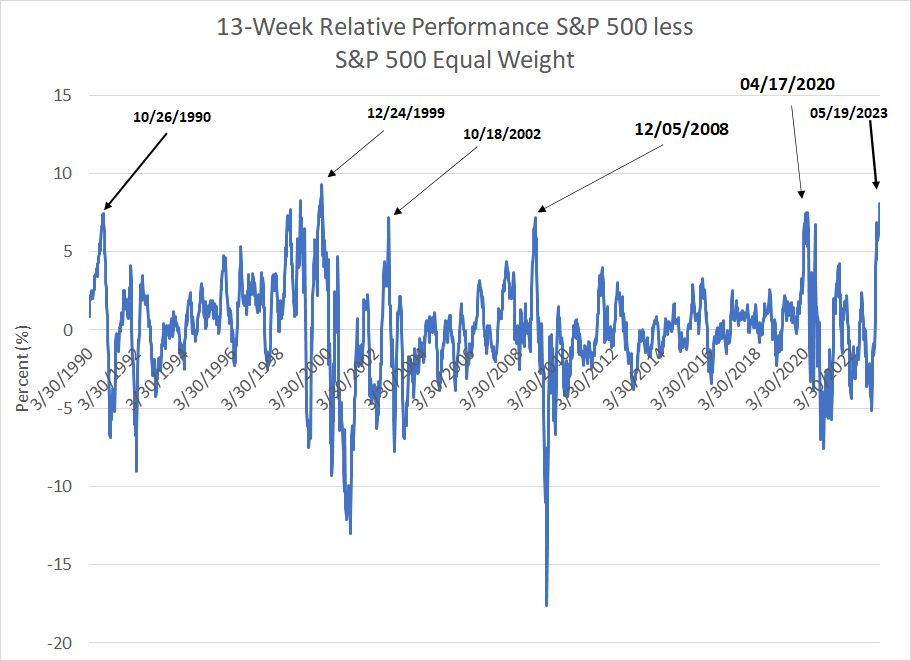
I examined rolling 13-week (1 quarter) returns for the S&P 500 and S&P 500 Equal Weight Indexes since December 29, 1989.
Take a look:
Source: Bloomberg
For the 13-week period ended May 19, 2023, the S&P 500 outperformed its EW counterpart by 8.1%.
Based on data since 1990 S&P 500 outperformance of that magnitude is almost a 2.7 standard deviation event. It’s been almost 24 years since market breadth has been as bad on this basis as it is right now – in the 13 weeks ended December 24, 1999 the S&P 500 Equal Weight underperformed by a record-setting 9.28 percentage points.
And there have been only a handful of occasions since the end of 1989 where breadth has even approached the current level. The list includes the middle of the 1990-91 US recession, the late 1990’s tech bubble, near the lows of the 2000-02 bear market, the height of the 2007-09 Great Recession and, of course, the height of the COVID panic in April 2020.
Two points to note:
First, S&P 500 outperformance of this magnitude usually happens when the broader indices are in a bear market.
For example, in the 13 weeks ended October 26, 1990, the S&P 500 was down almost 13%, outperforming the S&P 500 Equal Weight’s 20.4% decline over the same holding period.
In the 13 weeks ended December 5, 2008, the S&P 500 Equal Weight plummeted 36.2%; I’m sure stock market bulls of that era would be delighted to learn the S&P 500 outperformed over the same period by falling “only” 29%.
Finally, in the 3 months ended April 17, 2020 the S&P 500 plummeted 13.2%, but the EW counterpart was down even more at -20.7%.
This is likely a function of the fact that in weak markets, investors tend to regard larger stocks as more defensive investments better able to withstand a weaker economic environment. Indeed, the S&P 500 has a tendency to outperform both its EW counterpart and small and mid-cap indices like the Russell 2000 during bear markets.
In contrast, as of last Friday’s close, the S&P 500 was actually up by 8.1% compared to a 3.2% gain the S&P 500 Equal Weight Index. The only other comparable period on my chart was the August 1998 to December 1999 era when the S&P 500 often outperformed the S&P 500 EW in the context of a rising broader market.
Indeed, as I’ll outline in just a few moments, I believe the 1999-2000 period bears more than just a casual resemblance to the current market environment.
The second point to note is that, like many financial relationships, this one tends to be mean reverting.
In other words, when the S&P 500 outperforms the S&P 500 EW by an unusually large margin for a time, the EW Index tends to play catch up on a relative basis in subsequent periods.
For example, following the December 2008 spike in S&P 500 relative strength, the S&P 500 EW index rallied 17.3% in the ensuing 6 months, besting the S&P 500 by 13 percentage points. And, in the year that followed, the S&P 500 Equal Weight was up a whopping 46.5%, outperforming the 29.4% gain in the S&P 500 by 17.1 percentage points.
And that brings me to this:
The Summer of ‘99
In FMS, I’ve made the comparison between the 2000-02 cycle and the current market environment on a few occasions.
After all, the 2000-02 cycle started with the bursting of the late 1990s tech bubble in the spring of 2000, featured a long (1 year) delay from bull market peak to the start of recession and saw dramatic market declines despite a relatively mild recession in 2001.
However, the relative strength charts I just showed you look a good deal more like the summer of 1999, roughly 9 months before the market peaked in March 2000:

Source: Bloomberg
Starting in mid-June of 1999 the Equal-Weight S&P 500 began to underperform the market-cap weighted version as a narrowing list of technology and growth names accounted for most of the broader market strength. That trend didn’t reverse until the broader market peaked in late March 2000.
Indeed, over this time the S&P 500 was up a healthy 18.21% while the S&P 500 Equal Weight was down 3.2%. The Russell 1000 Growth Index soared 44% and the Nasdaq 100 was up an eye-popping 128.7%; yet the Russell 1000 Value Index, home to out-of-favor cyclical “Old Economy” names fell 3.4%.
In the year that followed this episode – March 27, 2000 through March 27, 2001 – the Nasdaq 100 collapsed 63.1%, the Russell 1000 Growth Index was down 41.8% and the S&P 500 was down 21.5%. Yet, despite those nasty losses, the Russell 1000 Value Index managed to eke out a 1.6% total return and the S&P 500 Equal-Weight Index was up 6.3%.
You could say this is how bubbles end – a final melt-up of speculative mania, concentrated in just a handful of favored names, followed by a devastating collapse, and change in market leadership.
There are cautionary lessons for both bulls and bears in this experience.
The bulls should be unnerved the recent rally has been largely a function of strong gains from a handful of stocks including the “Fab 5” I outlined in last week’s update. Also problematic is the market’s historic tendency to experience a “sell everything” moment as the prevailing market narrative shifts from concerns about rising interest rates to the cold, hard reality of an economic downturn.
However, the bears should be equally worried.
After all, while their caution ultimately proved prescient as the 2000-02 bear market unfolded, 1999 was not a great year to sit on the sidelines while the Nasdaq saw an historic surge. Yes, markets in the summer of 1999 were irrational; however, markets remained irrational for an additional 9 months, a lot longer than many of the bears of that era would have anticipated.
My view remains the US economy will slip into recession later this year and the broader market has yet to fully price in the likely hit to corporate earnings.
Put in a different way, if the S&P 500 were trading more in line with the Russell 2000– still down 27% from its late 2021 peak – I suspect the prevailing media and market narratives would be rather less sanguine and you wouldn’t be hearing much talk of a soft landing or “no landing” scenario for the economy.
As I’ve written a few times this year, eventually, something has to give.
Either the US economy will achieve a soft landing and cyclical stocks, commodities and small-caps will begin to participate in the market rally. Or, the megacap tech and growth leaders will fall back to Earth in a situation analogous to the year 2000 reckoning, and the S&P 500 will reach new bear market lows.
I continue to believe the latter is more likely though timing the top of the current narrow “Fab 5” melt-up, or the catalyst for a shift in sentiment, remains tricky and the bulls could certainly hold sway a bit longer as they did in early 2000.
In an upcoming issue I’ll take a deeper dive into the current (almost) unprecedented market environment and a few pockets of value I’m finding for investors right now.
DISCLAIMER: This article is not investment advice and represents the opinions of its author, Elliott Gue. The Free Market Speculator is NOT a securities broker/dealer or an investment advisor. You are responsible for your own investment decisions. All information contained in our newsletters and posts should be independently verified with the companies mentioned, and readers should always conduct their own research and due diligence and consider obtaining professional advice before making any investment decision.