

Something Has to Give
Something Has to Give
Either bonds or stocks are right, not both

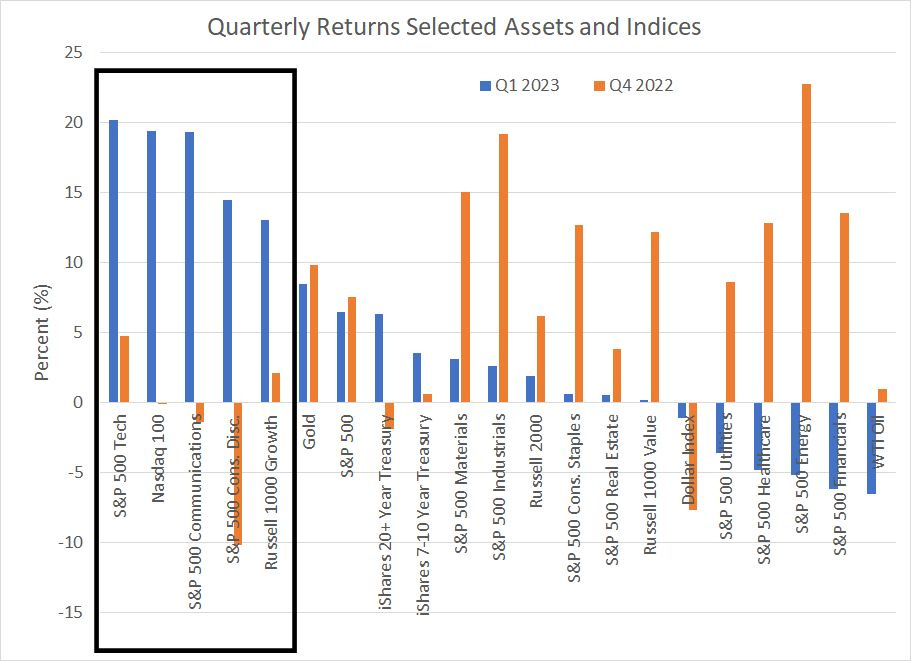
Last Friday marked the final trading day of Q1 2023, a good time to reflect on market returns in the first three months of the year:
Source: Bloomberg
This chart shows returns for a list of assets and indices in Q1 2023 (blue bars) and Q4 2022 (orange bars).
For equity markets, Q1 2023 was a quarter driven by growth and duration – the S&P 500 Information Technology Index, Nasdaq 100 and Russell 1000 Growth all produced double-digit gains for the quarter, reversing weakness in Q4 2022 and then some.
Meanwhile, value stocks, small caps and commodities – all shorter-duration and/or more cyclical investments -- lagged after producing some pretty impressive gains to end last year.
The most likely culprit for this reversal of fortune is also visible on this chart in the form of the positive Q1 2023 returns for the iShares 20+ Year Treasury ETF (NYSE: TLT) and the iShares 7-10 Year Treasury ETF (NYSE: IEF).
Rising bond prices imply falling yields, which is exactly what you’d expect to see when the US economy weakens. Of course, spreading fears of economic weakness also tend to act as a brake on the performance of more cyclical assets and equity indices including oil and the S&P 500 Energy Index, the Russell 1000 Value Index, and small-caps (Russell 2000).
Rise of the Lucky 7
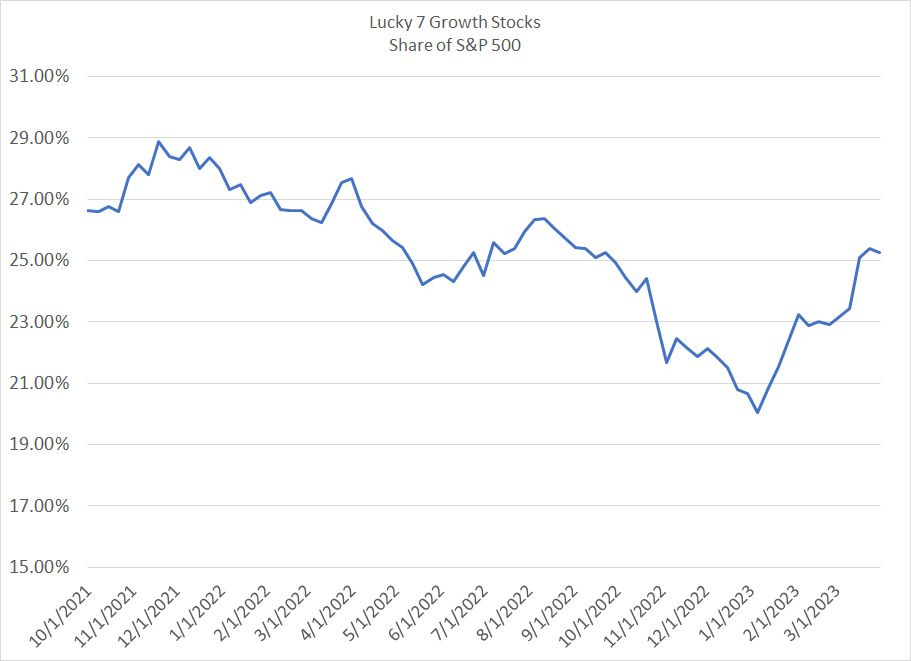
Indeed, as I described at some length in “Complacent Stocks Mask Rising Risks,” the broader market rally in Q1 2023 was dominated by a shrinking contingent of mega-cap growth stocks:
Source: Bloomberg
A group of 7 large cap growth stocks comprise the “Lucky 7” referenced on this chart: NVIDIA (NSDQ: NVDA), Amazon.Com (NSDQ: AMZN), Apple (NSDQ: AAPL), Meta (NSDQ: META), Microsoft (NSDQ: MSFT), Alphabet (NSDQ: GOOG), and Tesla (NSDQ: TSLA).
At the peak in November 2021, this group of 7 stocks had a combined weight in the S&P 500 of near 29% and at the lows last year that share had dropped to about 20%.
In Q1 2023, the Lucky 7 surged to more than a 25% weight in the S&P 500; more than 90% of the increase in the S&P 500 for the quarter can be attributed solely to the Lucky 7 growth contingent.
It seems investors remain determined to treat the stock market as a bet on Fed policy and a pivot away from the recent tightening campaign.
History suggests that’s unsustainable and longer-term it’s the health of the economy, not near-term adjustments to Fed monetary policy, that drives stocks.
Investors typically view markets in terms of quarters – quarterly returns, quarterly earnings and quarterly portfolio rebalancing by institutional investors are all real phenomena. So, it should hardly come as a surprise that quarter-end dates can often serve as a catalyst for markets reversals or accelerations of underlying trends. The rotation out of value and into the Lucky 7 in Q1 2023 is just such an example of a market reversal that coincided with the flip of the calendar.
Ultimately, Q2 2023 could prove an even more important inflection point. In this case, my view is that something has to give for markets in the coming quarter and one of the following two basic scenarios should play out.
Scenario #1: Bonds are Right
The biggest, and most important, shift in the bond market has been the shape of the yield curve:

Source: Bloomberg
This chart shows 3 different measures of the yield curve, the 10-Year less 3 Month Yield (blue line), the 10-Year less 2-Year (orange line) and the Near-Term Forward Spread.
Let’s start with the first two measures. An inversion of the 10-Year/3-Month and 10-year/2-Year yield curves – negative values in my chart above -- signals monetary policy is tight. Specifically, the Fed has more direct control over short term rates -- yields on 3-month or 2-year Treasuries – so when these yields are rising, it’s usually because the Fed is tightening policy.
The market sets longer-term yields based on longer-term expectations for Fed policy, economic growth, and inflation. Thus when short-term rates rise above long-term rates that’s a signal that Fed policy is currently tight, but the market expects rates, economic growth and inflation to fall in future.
This is crucial: It is NOT an inversion that indicates the market expects imminent recession, it’s the subsequent, rapid re-steepening of the curve from an inverted level.
This is a phenomenon I explained at some length in FMS here: “Yield Curves, Recessions and Bear Markets.”
When the yield curve rapidly re-steepens it’s usually because short-term rates fall far faster than long-term rates, an indication the market expects the Fed to start cutting rates to address economic growth concerns.
One more layer of granularity: Three-month T-Bill yields are driven entirely by market expectations regarding Fed policy over the next quarter, while two-year yields would include expectations for Fed policy over a longer time frame. Thus, the 10-year/2-year version of the yield curve will re-steepen first, before the 10-year/3-Month measure when recession comes into view.
This is exactly what we’ve seen so far this year. Both measures of the yield curve became more inverted than any other time in the past 40 years in Q1 2023 and the 10-year/2-year version saw a rapid re-steepening in March.
I generally look for the 10-Year/2-Year version to re-steepen to around +50 basis points before expecting a recession within 3 months and we’re not there yet. However, the curve has steepened from about -108 basis points in early March to -56 at the end of Q1 2023 and I’d expect further steepening in Q2 2023 if there’s any sign of weakness in the economic data.
Simply put, if current pricing in Fed Funds futures – 60% chance of a hike in May followed by more than 1% of easing by January 31, 2024 -- is even close to correct then both versions of the yield curve I just outlined would steepen to +50 bps by autumn at the latest.
And that brings me to the near-term forward spread also depicted in my chart above, something I wrote about in FMS last summer: “Canada’s Shocker.”
This spread compares forward rates for 3-month T-Bills 18 months in the future to the current yield on T-Bills. Simply put, when this spread flips negative, it suggests the central bank is expected to embark on a significant cutting campaign over the next year and a half.
An inversion of the near-term forward spread is similar in message to a re-steepening of the other two versions of the yield curve I just outlined.
The near-term forward spread recently reached its most inverted level ever of negative 143 basis points having first inverted in November 2022 for this cycle.
So, the bond market is telling us two things:
The US economy is headed for recession and, I’d argue, the recent re-steepening of the 10-Year/2-Year curve and record-setting inversion of the near-term forward spread hints the timing of that downturn is growing more imminent.
Expectations for the speed of rate cuts and the degree of curve inversions suggest the coming recession could be far more than a “mild” downturn as currently appears the consensus on Wall Street.
If the bond market is “right,” then I’d expect significant downside for the market from current levels coupled with upside for Treasury bonds (downside in yields).
While the market continues to treat technology and growth as both a haven from economic storms and a bet on lower rates, history suggests that’s not a viable strategy longer term.
After all, despite the dominance of growth stocks in the index, S&P 500 earnings estimates for the first three quarters of 2023 continue to deteriorate:
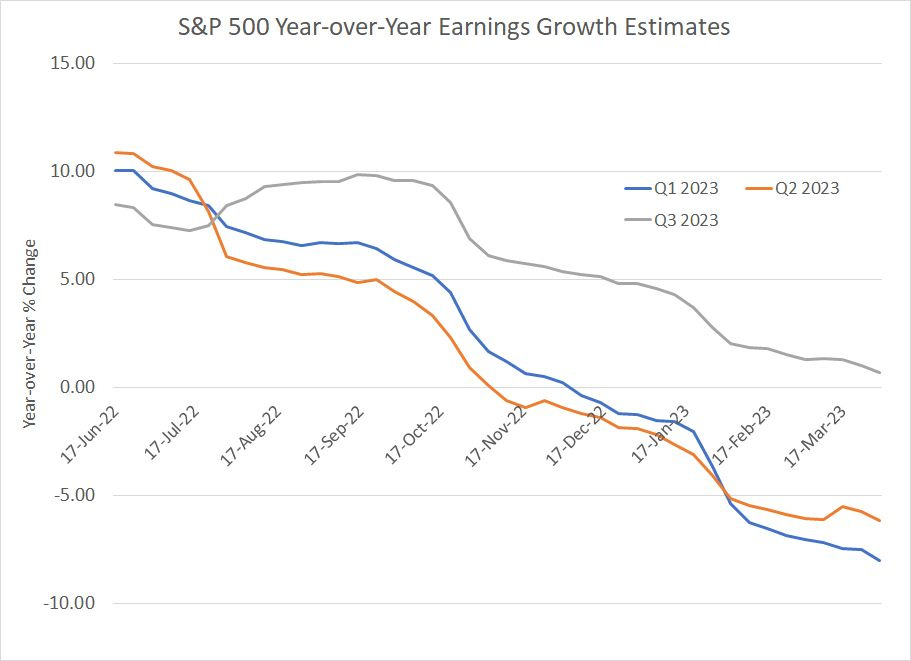
Source: Bloomberg
As you can see, year-over-year earnings growth estimates for the S&P 500 in both Q1 and Q2 2023 are now negative and Q3 2023 is headed in a similar direction.
Also note analyst earnings estimates tend to see the biggest revisions during quarterly earnings seasons; calendar Q1 2023 earnings season is due to (unofficially) kick off in less than two weeks with reports from two of the largest US banks, JP Morgan Chase (NYSE: JPM) and Citigroup (NYSE: C), before the opening bell on the 14th.
And that brings me to this:
Scenario #2: Stocks are Right
The message from the stock market remains a bit muddled.
You might argue the message is that there will be no recession, or the recession will be very mild by historical comparison. Further, equity bulls might argue, last year’s decline in the S&P 500 prices in the hit to corporate earnings likely amid a mild economic downturn.
One might also argue the stock market is priced as if recession doesn’t actually matter for the S&P 500 or the Nasdaq 100. Instead, stocks seem to be saying US economic growth can moderate by just enough to bring down inflationary pressures, allowing the Fed to ease rates later this year.
The bulls’ narrative holds that lower rates coupled with only a mild economic downturn would tend to boost growth stocks over value as the resulting decline in the discount factor overwhelms any temporary earnings hit for the Lucky 7. Meanwhile, cyclical sectors like energy and financials have more exposure to the economy, and benefit less from falling rates, so they’re underperforming.
Given the dominance of growth in the senior indices cyclical weakness is a manageable headwind for the broader market as long as tech and growth heavyweights can maintain their altitude as “defensive” investments.
Finally, one more component of all this is that bulls might plausibly argue there remain too many bears out there for markets to fall significantly:

Source: Bloomberg
This chart shows Non-Commercial traders net commitments in the S&P 500 futures market expressed as a z-score relative to the average over the past 156 weeks (3 years).
The current reading is -1.27, which means that S&P speculators have a net position in the futures that’s almost 1.3 standard deviations below the 3-year average – they’re bearish stocks.
Indeed, speculators have had little love for the recent rally, having maintained a sizable net short position for much of this year. While they appeared to cover some of their shorts in early March, the subsequent regional banking crisis turned nascent bulls bearish again in just one week.
Granted, futures market participants aren’t as bearish as they were last August (more than -2 standard deviations); however, this is the proverbial “Wall of Worry” stocks climb during bull markets.
What Gives?
Stocks and bonds can’t both be “right.”
As long-term readers can probably guess, I side with the bond market on this one; history suggests when stocks and bonds offer different messages, the bond market usually wins out. In addition, the economic indicators I follow, including the Conference Board’s LEI and the yield curve, all signal recession ahead.
Lags between these signals and the onset of recession vary, a fact that’s been on full display in the current cycle. However, my LEI indicator began to signal heightened risks last May and the yield curve inverted in Q2/Q3 2023 depending on which version you’re following; I’m currently looking for recession by Q3 of this year.
Further, as I’ve explained in recent updates, the bigger issue from the recent regional banking mess isn’t an imminent crisis or the collapse of a specific bank like Silicon Valley Bank or First Republic (NYSE: FRC), but the fact that risks to bank profitability and deposit flight will further tighten credit conditions.
If my baseline recession view proves correct, the entire market has significant downside from current levels regardless of when the Fed starts cutting rates and how fast rates decline.
The idea the market has already priced in the coming recession just doesn’t add up:
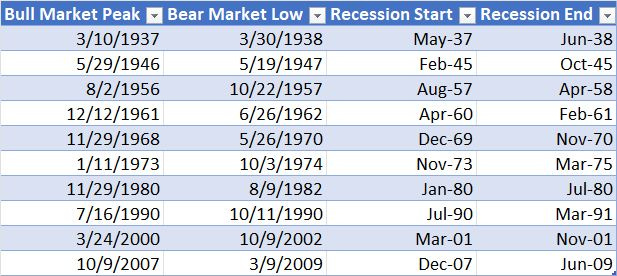
Source: Bloomberg
There have been two bear markets since the 1930s not accompanied by an NBER-defined recession, the first in the mid-1960s and the second in 1987; however, 10 of the last 12 bear markets have been accompanied by an economic downturn.
As you can see from my table of recessionary bear markets since the late 1930s, the typical pattern is for the stock market to peak before the start of recession and bottom before the end of recession. There are a couple of examples — such as 1946-47 and 1961-62 — where the stock market peaks long AFTER the start of recession. However, there’s not a single example on my chart of a scenario where the bear market ends before the recession even begins.
Stocks are forward looking, but they don’t price in a business cycle perfectly before it even happens.
The idea the S&P 500 can hold up because stocks like Microsoft, Apple and NVIDIA offer defensive growth is similarly implausible:
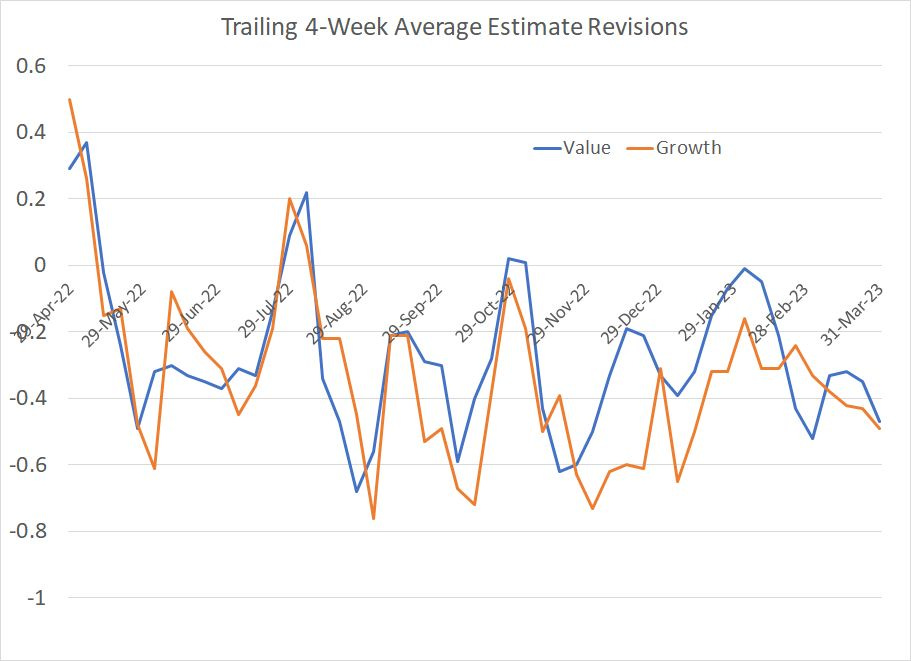
Source: Bloomberg
This chart shows analyst earnings revisions for stocks in the S&P 500 divided between Value and Growth stocks in the Index.
A negative number indicates that over the past four weeks Wall Street downside 12-month forward earnings estimate revisions exceed upside revisions.
For example, over the past 4 weeks analysts have adjusted 12-month forward earnings estimates significantly lower for 38 growth stocks and higher for 13 growth stocks, yielding a negative ratio of near -0.49 (38 less 13 divided by 51).
As you can see, downside earnings estimate revisions for growth stocks have been worse than for value stocks in most weeks since December 2022 and revision trends have steadily deteriorated since the middle of last year for both value and growth.
(So much for recession-resistant big cap tech stocks.)
I suspect the Pavlovian response to buy Microsoft, NVIDIA and Apple when the economic data sours is the product of recency bias and tech stock outperformance following the COVID stimulus boom of 2020. To say the 2020-21 market experience was unique in the post-war era would be an understatement; regardless there’s no dearth of would-be stock market soothsayers who claim timing the Fed pivot is the key to stock market riches.
There’s an old saw the most expensive words in markets are “This time it’s different.”
Arguing that the Fed can pivot with inflation at generational highs without economic consequences, that the stock market has already priced in recession which has yet to begin, that tech stocks are not subject to the business cycle or that the market is “cheap,” valued at a cyclically adjusted price-to-earnings multiple of more than 30 are all examples of this type of “thinking.”
A more plausible explanation in my view is the recent bounce in stocks is little more than a bear market rally before the start of a new leg lower. After all, there is historic precedent for just such a move prior to, or soon after, the start of a US recession:
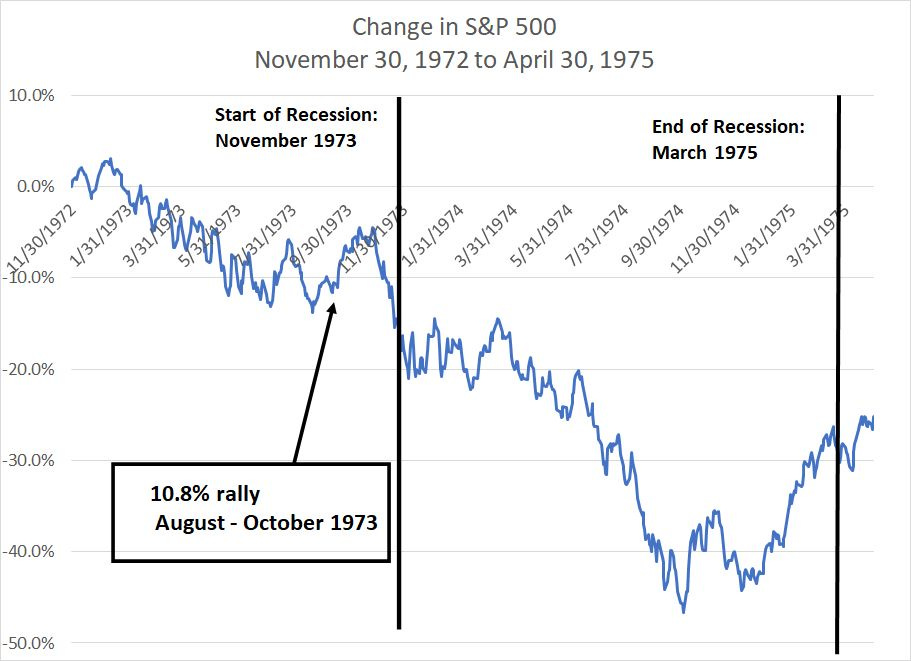
Source: Bloomberg
In the vicious 1973-75 cycle, the S&P 500 peaked in January 1973, long before the US economy entered recession in November 1973.
As you can see, this bear market got off to a slow start with the S&P 500 down in the 10% range through November 1973. The decline accelerated around the time the US recession got underway and through the first half of 1974.
And, just prior to the official start of recession, the S&P 500 enjoyed a 10.8% rally from August through late October.
Something similar happened in the 2000-02 cycle:

Source: Bloomberg
In this cycle, the S&P 500 peaked in March 2000 then enjoyed a 12%+ rally in the April-September period.
The economy didn’t enter recession until March 2001 and, just after the recession kicked off, the S&P 500 enjoyed a 19% rally in April-May 2001 before the downtrend resumed.
Even in 2008, one of the worst years for the US economy since the Great Depression, the S&P 500 enjoyed a 12% bounce in the March to May 2008 period; the Nasdaq 100 was up a whopping 22.5% over the same time frame.
Simply put, it’s not uncommon for equity markets to enjoy a bounce just before or just after the start of a US recession. Typically that’s a function of optimism the US might be able to enjoy a soft landing or that the market decline leading into the downturn has already priced in the risks.
The bad news is the most intense phase of the bear markets typically begins after it becomes obvious the US economy has entered recession. My view remains that this time is NOT different and new lows lie ahead.
DISCLAIMER: This article is not investment advice and represents the opinions of its author, Elliott Gue. The Free Market Speculator is NOT a securities broker/dealer or an investment advisor. You are responsible for your own investment decisions. All information contained in our newsletters and posts should be independently verified with the companies mentioned, and readers should always conduct their own research and due diligence and consider obtaining professional advice before making any investment decision.