

The Great SPR Scam
The Great SPR Scam
What happens when the charade unwinds?

Every Wednesday morning at 10 AM, the Energy Information Administration (EIA), part of the US Department of Energy, releases its estimate of total inventories of crude oil held in storage in the US.
This chart shows the cumulative change in US oil inventories since the end of 1999:
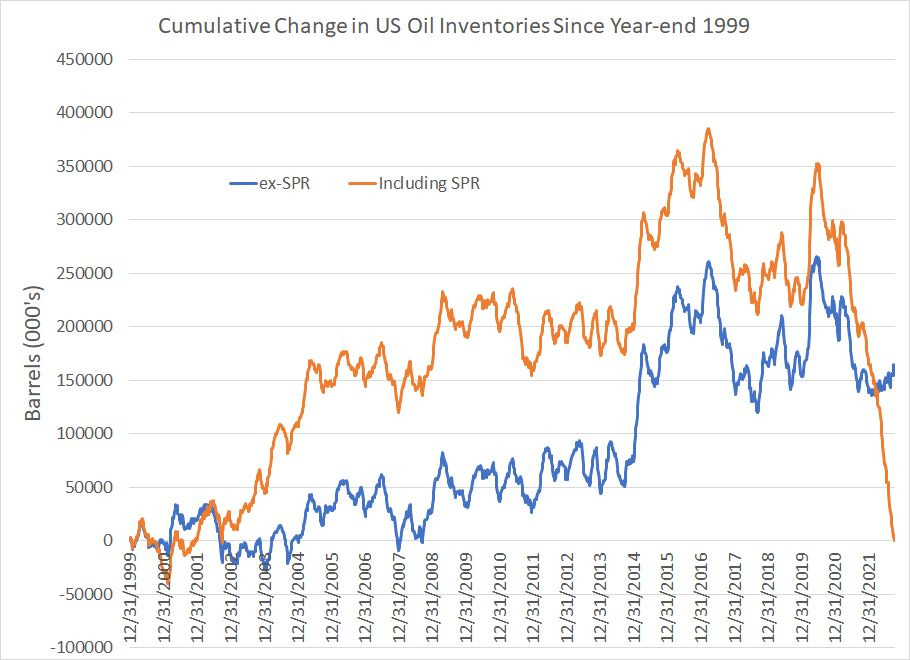
Source: Energy Information Administration, Bloomberg
As you can see, this chart includes two different measures of US oil inventories: Commercial oil inventories excluding the Strategic Petroleum Reserve (SPR) and total US oil inventories including the federal government-controlled SPR.
The period covered by this chart includes changes in US oil inventories under five different Presidents: The tail end of the Clinton administration, the entire George W. Bush administration, the Obama years, Trump years and, of course, Biden’s term so far.
As you can see, the pattern in these two lines is not identical, but they’ve tended to track closely over time until earlier this year when total US oil inventories including SPR have plummeted while the ex-SPR figure has remained broadly range bound.
Let’s take a look at a close-up of the same data since the end of 2018:
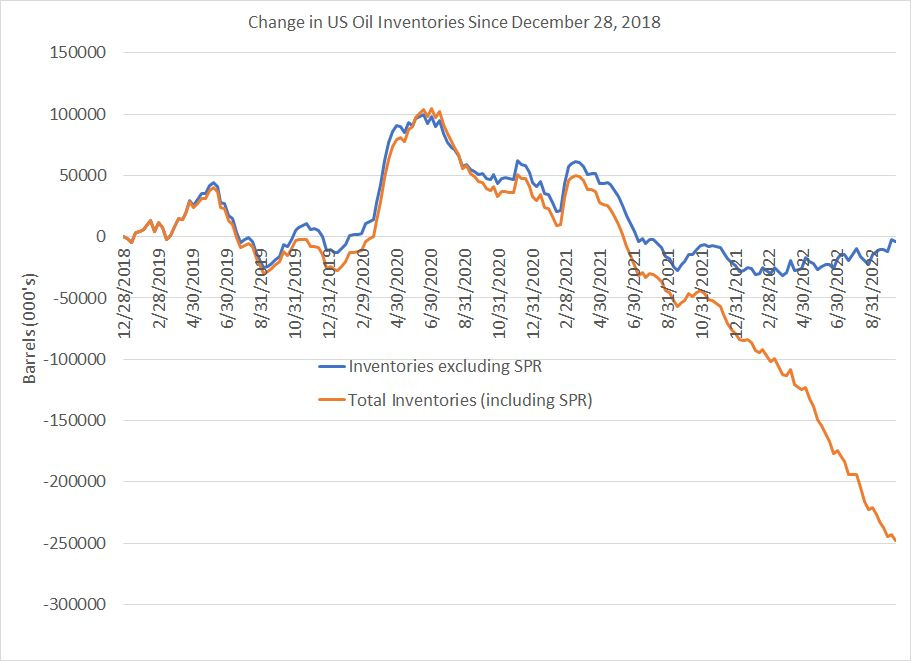
Source: Energy Information Administration, Bloomberg
On this shorter-term chart, the dramatic shift in US oil inventories that started last spring is even more glaring.
The pattern in US inventories on both a total basis and excluding SPR is nearly identical up until April 2021 when the Biden Administration announced a massive drawdown in the US Strategic Petroleum Reserve, totaling as much as 1.5 million bbl/day over a six month period. Since then, the total inventories figure has plummeted while the ex-SPR line has been flat.
Oil inventories represent a buffer between the supply of oil and demand for oil.
Thus, if total US oil supply in a given week — the sum of domestic production and imports — is higher than demand for oil in the same week, the US will add to inventories. Of course, the opposite is also true — when demand exceeds supply, refiners can make up the shortfall by drawing down oil storage tanks.
The main reason oil inventories rise or fall in a given week is the seasonal pattern of demand — simply put, while US oil demand averages about 19 to 20 million bbl/day over the course of a year that demand is not constant. During periods of low seasonal demand, such as the spring months, US oil inventories tend to rise; the opposite is true during peak seasonal demand in summer driving/travel season.
Take a look:
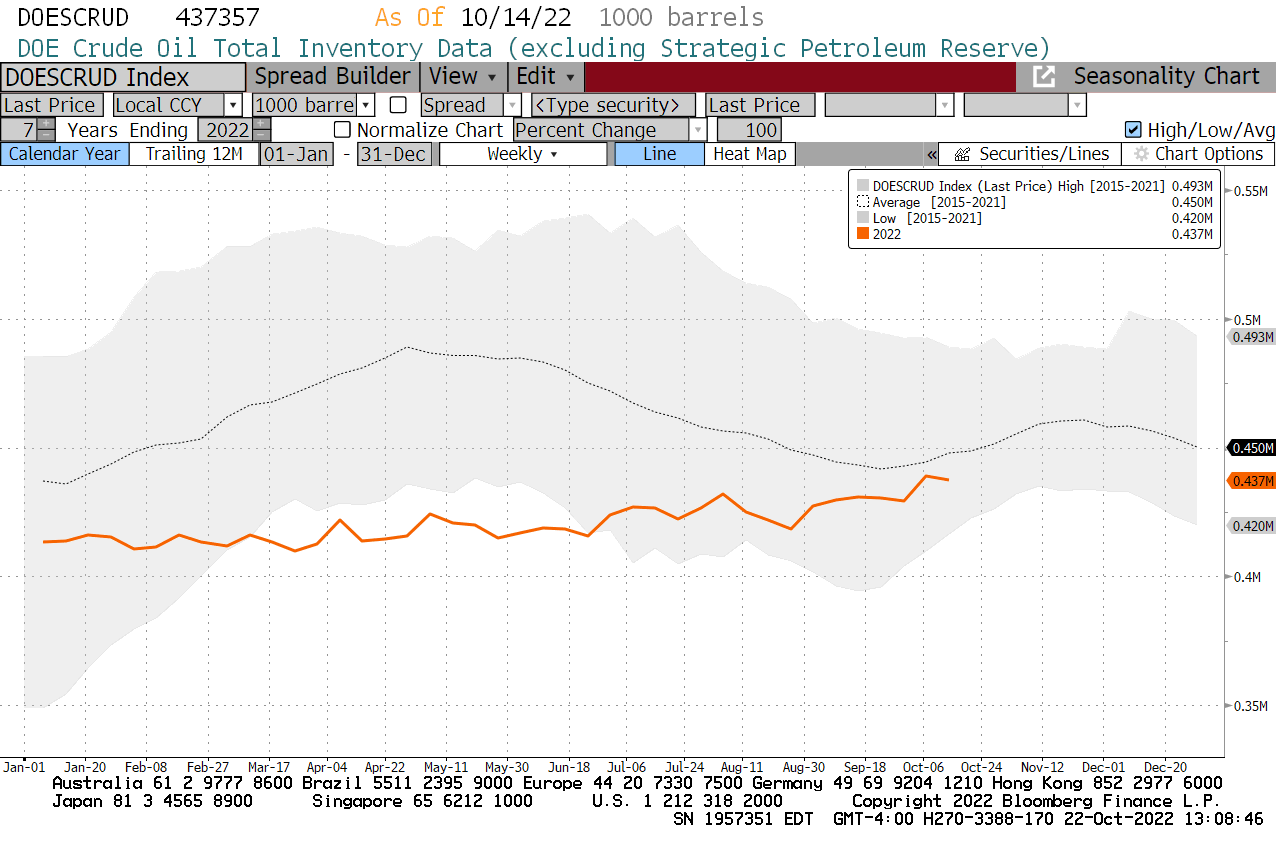
Source: Bloomberg
This is a seasonal chart of US oil inventories. The gray shaded region represents highs and lows for oil inventories on a seasonal basis for every week of the year over the past 7 years. The dotted line is the 7-year seasonal average and the orange line shows the path of US oil inventories so far in 2022.
This point is crucial: This data represents oil inventories excluding SPR.
Look at the 7-year average and you can clearly see the normal seasonal pattern — oil inventories rise from January into April/May in a normal year as demand is seasonally weak and refiners prepare for the surge in summer demand. Inventories then fall sharply through the summer, reaching a low in September/October as refiners draw down inventories to meet elevated demand for gasoline, diesel, jet fuel and other refined products.
That’s why one of the main fundamentals to watch in the oil market is deviations from seasonal norms. In other words, a decline in US oil inventories in the summer is expected and normally meaningless; however, if US oil inventories rise in the summer months that’s bearish because it means either summer demand is weak and/or oil supply is unusually high.
Similarly, inventories should rise in the spring months; if inventories are flat or fall that’s bullish for oil prices as it suggests there’s weak supply or unusually strong demand.
Now, look at the 2022 plot.
US oil inventories were essentially flat through the spring months this year, a period when commercial stocks of oil should be rising ahead of the summer driving season. Indeed, from late February through to June, US commercial oil inventories set 7+ year seasonal lows.
That led to fears inventories would be insufficient to meet summertime demand for oil and contributed to the spike in oil prices over $120/bbl (WTI) by mid-June.
However, what happened after that is just as interesting: US commercial oil inventories started to drift HIGHER even as summer travel season reached its seasonal peak. This counter-seasonal inventory build has pushed oil inventories back close to the 7-year seasonal average in the past two weeks.
I’d argue this counter-seasonal build also contributed to the pullback in oil prices from their June highs to lows under $80/bbl in late September.
However, look at this chart:
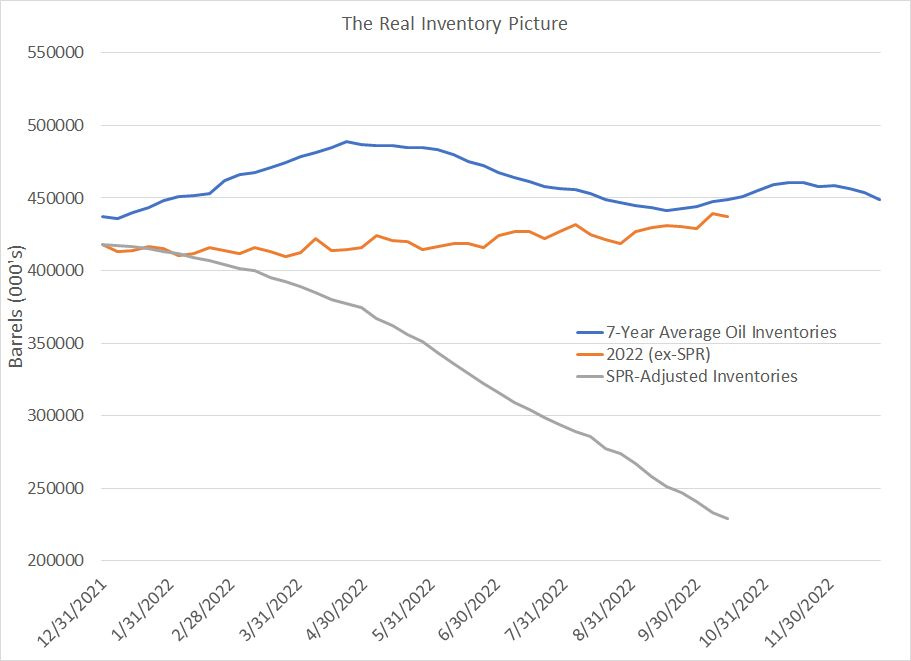
Source: Energy Information Administration, Bloomberg
This is a similar chart to what I just showed you — a seasonal plot showing 7-year average oil inventories (blue line) and the 2022 level (orange line). In addition, however, I’ve added a third line to show US oil inventories adjusted for the SPR releases so far this year.
When oil is released from SPR, those barrels add to commercial oil supply available to refiners. Thus, in periods when oil imports and domestic production are not enough to meet demand — the normal scenario in summer months — barrels from SPR can help alleviate the seasonal demand draw on inventories.
That’s exactly what’s happened — US commercial oil inventories (the orange line) rose counter-seasonally this past summer ONLY because the government released up to 1.5 million barrels per day (10. 5 million barrels per week) from SPR.
Since the Energy Information Administration reports the size of the SPR each week, we can adjust the commercial oil inventory figures to reflect those releases. As you can see, this line (in grey) plummeted straight through summer driving season.
Not only that, but the adjusted inventory figure actually declined at a far faster pace than normal for this time of year. That’s obvious when you consider that the slope of the grey line (adjusted 2022) is much steeper than the blue line (7-year seasonal average).
Indeed, if it were not for SPR releases this summer, US commercial oil inventories would likely currently be sitting at the lowest level since at least 1982, when the EIA began reporting this data series.
Of course, the oil market likely would not have “allowed” oil inventories to drop that fast because that’s just not how markets work. The more likely outcome is that oil prices would have spiked to such an extreme level it would have resulted in serious demand destruction and/or incentivized additional production and imports.
And that brings me to the worst news of all — this artificial oil supply gravy train is about to come to an end.
Just last week, President Biden announced the sale of a final 15 million barrels of oil from SPR which will be completed in December this year. The president also indicated the Department of Energy will be ready to conduct additional “significant” releases if needed this winter.
However, since the end of April alone, the government has released almost 145 million barrels from SPR, bringing the reserve to just over 405 million barrels as of October 14th, the smallest since 1984. The government simply can’t continue to release oil at this pace for much longer without depleting the reserve to dangerously low levels that call into question the SPR’s adequacy in the face of real longer term supply disruptions.
Indeed, the additional 15 million bbl/day SPR release the Biden administration just announced will only add around 500,000 barrels per day to US supply in December, roughly one-third of the peak daily supply release earlier this year.
Bottom line: between now and year-end, the oil market will need to contend with the loss of more than 1 million bbl/day of incremental supply from SPR, the loss of millions of additional barrels of OPEC output and the loss of some Russian barrels as the US and EU seek to ramp up sanctions and impose a Russian oil price cap.
While a weakening global economy is likely to reduce demand somewhat, it’s not enough offset these ongoing supply issues. I’m looking for oil to remain well-supported in the $70 to $80/bbl range and additional rallies over $100/bbl are likely.