

The "Science" of Outside Reversal Days
The "Science" of Outside Reversal Days
Plus: Treasuries as a hedge against stock market downside...

As many of you have probably heard, artificial intelligence (AI) bellwether NVIDIA (NSDQ: NVDA) reported blow-out quarterly results last week, beating earnings estimates by more than 30% and raising guidance well above Wall Street expectations.
Thursday morning, the first trading day after the company’s release, the stock opened at an all-time high of $502.66 per share, valuing the company at more than $1.2 trillion, not bad for a company that was worth around $300 billion at the lows late last year.
However, Thursday’s session didn’t end well for the bulls. While NVDA did manage to close higher, it was only by a measly 0.1% and down a whopping 6.2% from its morning peak.
The Invesco QQQ Trust (NSDQ: QQQ), a popular exchange-traded fund (ETF) designed to track the Nasdaq 100 Index, printed a nasty reversal candle on the charts:
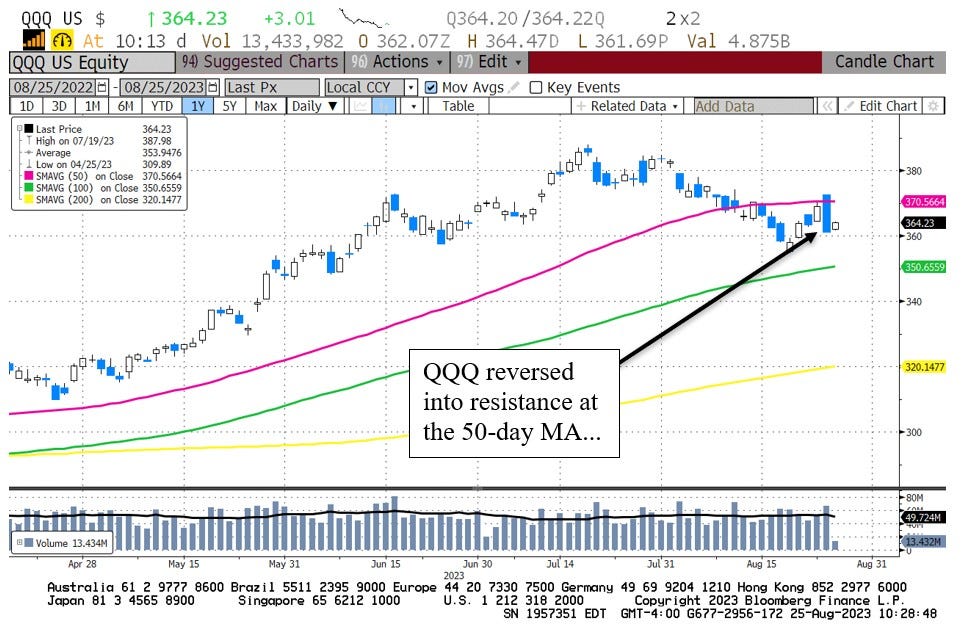
Source: Bloomberg
The QQQ, buoyed by NVDA and AI-fueled optimism, opened the session almost 1% higher and 0.7% above the highs on Wednesday, the prior trading day. The QQQ then closed near the lows of the session, down more than 2% on the day and well below Wednesday’s lows.
This is what technicians call a “bearish engulfing” pattern or an “outside reversal” day – the idea is that significant bullish optimism in the morning invites sellers, sending the market sharply lower into the close.
It’s also an example of what I believe to be one of the most powerful tenets of trading – the market’s reaction to the news is more powerful than the news itself. In other words, if a stock beats earnings estimates – as NVDA handily did this week – and then closes lower or, in this case, well off its highs, that suggests that the good news was likely already in the stock and traders used the morning strength to book gains.
However, is yesterday’s ominous bearish reversal in the QQQ right into key resistance at the 50-day moving average a sign of more selling pressure to come?
Fortunately, we don’t just have to guess, let’s look at the history of this signal:
QQQ Reversal Days
We have daily trading data on the QQQ ETF stretching back to March 1999, so I looked for QQQ trading days that met 3 key criteria:
1. The open price for QQQ is 0.5% or more above the highs (HIGHS, Not Close) for the prior trading session.
2. The close for QQQ is 1.5% or more below the close of the prior session.
3. The QQQ close is more than 0.5% below the lows of the previous session.
Simply put, if a trading day meets all three of these criteria it’s a bearish reversal day in my book. It’s also an exceedingly rare signal – out of the 6,155 trading days since March 1999, this one-day reversal signal has only “tripped” a total of nine (9) times, including Thursday August 24th.
Take a look:

Source: Bloomberg
This table shows all 9 trading days since 1999 where all conditions are met. I’ve also included columns showing the subsequent returns from buying QQQ out to 26 weeks (6 months).
Simply put, this sort of one-day outside reversal isn’t very effective as a short-term trading tool. Indeed, in only 2 cases out of 8 (25% of the time), did the QQQ close lower one week after such a signal and the average return is +2.9%, which is well above the average 0.24% return from holding the QQQ for 5 days over a similar sample period.
The same basic effect holds out to about 5 weeks – if anything, QQQ outside reversal days like this tend to be slightly bullish.
At 13- and 26-week holding periods the pattern is a bit more interesting. While the averages are still healthy and positive, that’s mainly due to signals from back in 1999, the height of the late-90’s dot-com and technology bubble. Signals in 2000, 2004 and 2022 ultimately did point to significant additional downside in stocks.
Let’s put this effect into some context:
The 1999-2000 Tech Melt-Up
Here’s a closer look at those QQQ outside reversal days back in 1999:
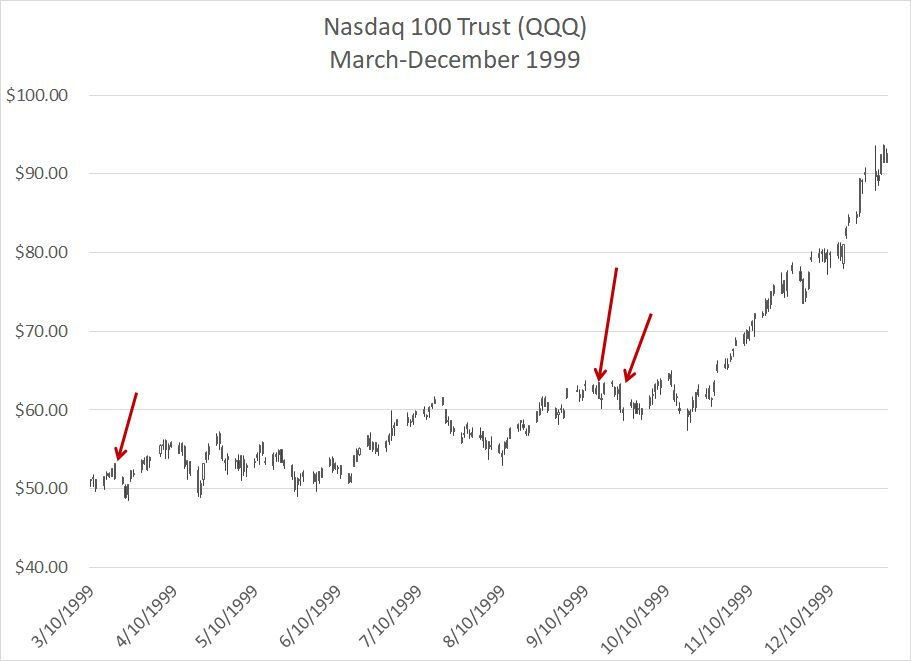
Source: Bloomberg
There’s a tendency to remember 1999 as a great year for the stock market; it certainly was with the Nasdaq 100, up a whopping 102.1%, and the S&P 500 up a little over 21%.
However, there were two distinct phases for equity markets that year – the S&P 500, for example, was only up about 3.6% from the end of 1998 through October 19, 1999, so virtually all the market advance that year came in the final two-and-a-half months. From October 19, 1999, through the end of the year, the S&P 500 soared 16.8% and the Nasdaq 100 was up a shocking 57%.
More broadly, the market rally that began on October 19th, 1999 marked the final, spectacular melt-up of the late 90’s bull market. From October 19th through the cycle high the following March, the Nasdaq 100 nearly doubled while the S&P 500 was up some 21.7%.
I’d note two points about this period.
First, the three outside reversal days on my chart in 1999 did all signal short-term pullbacks or periods of market consolidation. While the market didn’t sell off significantly, a quick glance at the chart reveals these weren’t exactly great buy signals either.
Second, powerful momentum – such as we saw in 1999 and more recently in stocks like NVDA – doesn’t really die in a single trading day. It’s more of a process where the bulls start to become exhausted after a relentless advance, bears capitulate on stocks and good news for the market starts to have less of a positive impact on the averages.
The fact that half (4 of 8 prior to this week) of the outside reversal signals in my table above occurred in the very final stages of the Nasdaq’s 1999-2000 melt up, and just ahead of the historic 2000-02 market collapse, suggests they could very well be early warning signs of an exhausting market uptrend.
Third, these outside reversal signals became far less common after 1999-2001 with only three such signals, including this week’s, in the past 20 years. While that’s hardly a statistically significant sample size, both more recent signals have carried more predictive power, signaling intermediate-term tradeable market declines. Thus, it could be the frequency of this signal in 1999-2001 is partly a function of the increased volatility of the then-new QQQ exchange traded fund.
So, is the outside reversal day on Thursday August 24th a signal to sell stocks or load up on inverse ETFs?
In the short-term the answer is no – history suggests that, if anything, it’s a modest bullish signal for QQQ over the next 1 to 5 weeks though the sample size for such signals is small.
The word “science” gets used casually these days. However, I consider science a process of advancing a hypothesis about something, evaluating evidence or designing experiments to test it, and then determining whether your hypothesis is true or false. Well, I must admit my hypothesis heading into this was that outside reversal days are bearish, and the fact is that, at least for the limited sample size I examined, my hypothesis was wrong.
Whether they support my hypothesis or not, however, the numbers are the numbers, and the facts are facts. Even after last Thursday’s bloodbath, pullbacks in the Nasdaq 100 and S&P 500 look like little more than box-standard corrections that are still holding well above multiple obvious technical support levels:

Source: Bloomberg
The region bounded by the 100-day and 200-day simple moving averages tends to act as support for major averages like the S&P 500 and the Nasdaq 100 during short-term pullbacks amid longer-term rallies.
Right now, the S&P 500 is hovering around 4,400 and these averages are sitting in the 4,150 to 4,300 region, leaving the S&P 500 in a comfortable uptrend, though vulnerable to a bit of profit-taking into September, seasonally the weakest month of the year.
Longer term, for months now I just haven’t been able to shake a feeling of déjà vu.
There are some pretty obvious fundamental and technical parallels to the 1999-03 period. In the first seven months of this year, for example, we’ve seen a strong stock market rally driven by a small cadre of large-cap growth and technology names. While the names leading the advance aren’t the same as they were a quarter century ago, the final stages of the rally in 1998 to 2000 also exhibited a powerful advance on weak market breadth.
Today, we have an “exciting” investment theme in the form of artificial intelligence (AI) that some say will revolutionize the economy, increase corporate efficiency, cut costs and boost profits.
For those of you who lived through the 1997 to 2003 stock market roller coaster ride, doesn’t that sound pretty similar to talk of the “New Economy” and a new era of permanently higher corporate profitability and employment thanks to computer networking and the Internet that was so pervasive back in 1999-2000?
Perhaps the AI boosters are right.
After all, 25 years ago the bulls were absolutely and undeniably right about the Internet changing our lives. However, much as growth in networking 25 years ago didn’t support Cisco Systems (NSDQ: CSCO) at 40 times revenues, it’s quite possible AI won’t support NVDA at 40 times sales today.
Perhaps you recall, as I do, the talk of “soft landing” for the US economy in the summer and autumn of 2000, after the stock market had already peaked and months before the Federal Reserve started to cut interest rates. After all, in September 2000, the US unemployment rate stood at 3.9%, the lowest level since January 1970.
How could the consumer possibly retrench with labor market conditions so strong, right?
Bottom line: It’s always tough to time the top of a speculative market melt-up precisely.
However, when you couple last week’s outside reversal day following NVDA earnings with clear signals of building headwinds for the US economy, a recession in Europe and a rapid slowdown in China, I believe in five years’ time, we’ll look back on the current market environment as an outstanding selling opportunity.
How About those Bonds Part II
In the August 15th issue “How About Those Bonds,” I wrote about weakness in US Treasury bond prices of late and instruments like the iShares 20+ Year Treasury Bond ETF (NYSE: TLT), which tracks long-term US government debt.
Specifically, I wrote that in modern cycles Treasuries have usually acted as a solid hedge against equity market weakness. In 2008, for example, the S&P 500 was down 36.5% and the iShares 20+ Year Treasury ETF jumped 32.9% as investors ran for the safety of Treasuries and the Fed slashed rates.
However, as I also explained, this hasn’t always been the case. Back in the inflationary cycles of late 1960s through the early 1980s, there are plenty of examples of occasions where Treasuries and stocks moved lower together, making bonds an imperfect hedge.
A few readers have asked me if the current cycle is more like the 1970s – characterized by stubbornly high inflation and the need for the Fed to maintain “higher for longer” interest rate -- doesn’t that mean ETFs like TLT would fall in value alongside the S&P 500?
The answer is a bit more complex.
Bloomberg compiles data on total returns from Treasury bonds – including price changes and interest paid – back to January 31, 1973.
The US stock market peaked on January 11, 1973 and fell 43% including dividends to a low on October 3, 1974, one of the worst, and longest, bear markets in US history. Per the National Bureau of Economic Research (NBER) Business Cycle Dating Committee, the US economy entered recession in November 1973 and exited in March 1975.
So, how did bonds act as a hedge during this nasty inflationary bear market and recession cycle?
Well, the return from the S&P 500 from the end of January 1973 through the end of September 1974 – the heart of the 1973-74 bear market – was -41.8% including dividends. The return over the same period for the Bloomberg Aggregate Treasury Bond Index was +7.13%, representing outperformance of close to 50 percentage points.
Meanwhile, the Bloomberg Treasury Bond “Long” Index which tracks total returns from US government bonds with more than 10 years duration – more sensitive to changes in US interest rates -- was down 0.84% over this period.
And if we track the performance of the S&P 500 from the date the economy entered recession – October 31, 1973 – through the end of February 1975 when the economy exited recession, then long-term Treasuries returned 7.34%, the Bloomberg Aggregate Treasury Bond Index was up more than 10.1% and the S&P 500 was down more than 20%.
So, in the inflationary 1973-1975 recession and bear market cycle, Treasuries did not perform as well as in 2007-09 or 2000-02 as a hedge against broader downside in the stock market. However, even for the more rate-sensitive Treasuries, bonds still outperformed the stock market by a sizable margin and produced some ballast for portfolios amid a very tough economic and market environment.
Take a look:
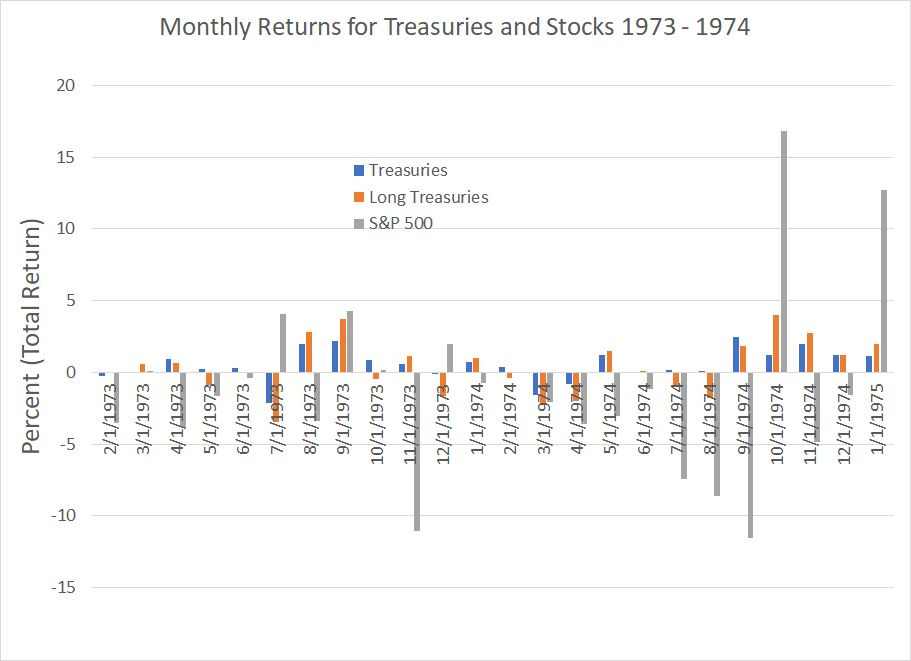
Source: Bloomberg
Just compare the wild month-to-month swings in the S&P 500 (grey bars) to the moves in Treasuries (blue and orange bars) – Treasuries were clearly far less volatile than stocks through this bear market and produced positive gains in some very weak months for stocks like November 1973 and September 1974.
I see three implications.
First, for traders, or those willing to move in and out of Treasuries over time, I see lots of opportunity to buy weakness in bonds (spikes in yields) as the economy weakens. Even in the inflationary 1973 to 1975 cycle, investors still did run for the safety of the Treasury bond market when stock market sells off, and extreme weakness in bonds (spikes in yields) does tend to attract buyers interested in yield.
Second, for longer term investors seeking a hedge against a tough stock market, inflation and recession, there are multiple options including gold or inverse ETFs designed to profit from a decline in the broader stock market.
However, I firmly believe Treasuries should be one (major) hedging tool in your toolbox – after all, if you anticipate market weakness, buy an inverse and the stock market rallies, you’ll lose money. With bonds, or an ETF like the TLT, a rising stock market doesn’t necessarily mean you’ll lose money – in January of this year, for example, the S&P 500 was up 6.3% and iShares 20+Year Treasury Bond ETF was up even more, rising 7.65%.
Third, I don’t believe investors fully appreciate how unusual 2022 was by any historic yardstick:
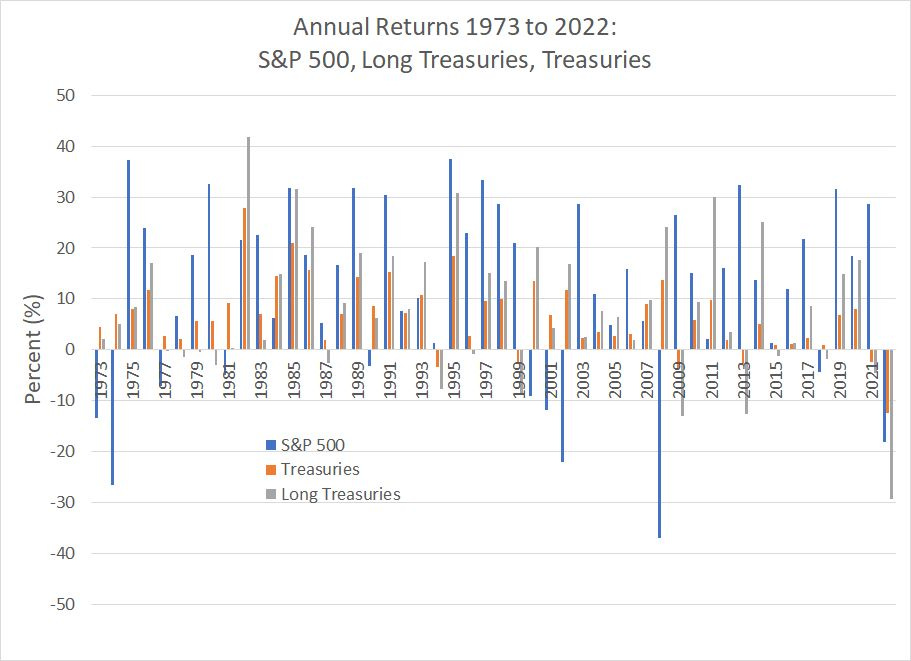
Source: Bloomberg
This chart shows total annual returns for the S&P 500 (blue), Bloomberg Aggregate Treasuries (orange) and Long-Term Treasuries (grey) from 1973 to 2022.
As you can see here, last year’s returns from Treasuries and long-term Treasuries showed the worst annual returns of any year on my table – the worst returns from the bond market in 50 years on top of the fourth-worst returns from the stock market for any year since 1973.
Even more bizarre, 2022 is the only year in the last 50 where the return from a portfolio of long-term Treasuries Bonds was worse than the S&P 500 – long-term Treasuries collapsed 29.3% against an 18.3%+ decline for the S&P 500.
Sure, it’s possible lightning could strike twice in consecutive years; however, I believe it’s more likely that 2022 was an aberration due to extremely depressed interest rates in late 2021 (the 10-year offered a yield of just 1.5% on December 31, 2021).
DISCLAIMER: This article is not investment advice and represents the opinions of its author, Elliott Gue. The Free Market Speculator is NOT a securities broker/dealer or an investment advisor. You are responsible for your own investment decisions. All information contained in our newsletters and posts should be independently verified with the companies mentioned, and readers should always conduct their own research and due diligence and consider obtaining professional advice before making any investment decision.