

VIX is High, Time to Buy?
VIX is High, Time to Buy?

It’s been a tough January for the stock market with the Nasdaq 100 and S&P 500 down 11.4% and 6.93% year-to-date respectively.
The Nasdaq 100 is now down more than 12.7% on a closing basis from its highs in November and, as I explained in my January 15th post “Rate Scare, Growth Scare,” most stocks in the Nasdaq are down far more than the headline decline in the index would suggest.
After a drubbing like that, especially given the success of simple “buy the dip” strategies over the past 18 months, it’s only natural some are wondering if we’re close to a bottom or, at a minimum, due for an epic bounce.
In environments like this I always get questions about the S&P 500 Volatility Index, more commonly known by its symbol “VIX,” and its Nasdaq equivalent, the NDX Volatility Index (VXN).
If you’re not familiar with these indicators, here’s a (brief) primer:
The VIX is an index of implied volatility priced into the S&P 500 index options market while the VXN tracks volatility in Nasdaq 100 options. Simply put, the higher implied volatility, the more expensive put and call options on the major indices; in most cases, a spike in implied volatility and options prices indicates investors are buying put options to hedge against market downside.
When the market bottoms there’s usually a pervasive sense of fear and that’s the origin of a simple rhyme you may have heard:
“When the VIX is high, it’s time to buy.”
To illustrate, let’s look at a chart of the VXN and the Nasdaq 100 since late 2020:

Source: Bloomberg
I’ve marked a total of 6 minor corrections in the NDX since the end of October 2020 (blue line) and, as you can see, the nadir of each sell-off corresponds to a spike in the VXN (orange bars).
A quick glance at the hard right edge of my chart reveals the biggest spike in the VXN in about a year last week to a closing high of 38.2 on the 25th. That certainly fits the pattern of selloffs since late 2020 and the Nasdaq’s rally in the second half of the week would seem to confirm that view.
However, looking at just 15 months of history for any indicator can be misleading. After all, the period from October through the end of 2021 was a ripping bull market for equities, exactly the sort of environment where any dip-buying strategy could be expected to work.
Let’s dig a bit deeper and stress-test this indicator over a longer time.
I looked at data on the S&P 500 Volatility Index (VIX) since 1990. To define a “spike” in the VIX, I calculated a 60-trading day simple moving average of the VIX and the standard deviation over the same rolling period.
I considered any close in the VIX more than 2 standard deviations above that 60-day moving average to be a “spike” and a buy signal for the S&P.
Here’s what I found:

Source: Bloomberg
I evaluated holding periods of 5, 10 and 20 trading days following each VIX signal, and the results aren’t great.
There were 572 VIX signals on this basis since 1990 and the S&P 500 gained an average of 0.303% in the 5 trading days following each VIX signal. While that’s positive, the average rolling 5 trading day holding period return over the same time frame is about 0.229%, so not much of an improvement.
And, looking at rolling 5-day holding periods since 1990, the S&P 500 produces a positive total return about 58.7% of the time (a negative return 41.3% of the time). Following one of these VIX signals, that only improves slightly – the S&P 500 was positive 62.8% of the time and negative 37.2% of the time over 5 trading days following VIX spikes.
The outcome only grows less impressive if we increase the length of the holding period to 10 or 20 trading days – in both cases, the average return following a VIX signal was actually LOWER than the equivalent average holding period return for the entire sample.
Quickly eyeballing the data, I noticed one problem with these signals is that they tend to come in groups, particularly in bear markets. So, the VIX will spike and then signal for 3 or more straight trading days. Since we’re looking at rolling holding period returns, this results in multiple consecutive “bad” signals and skews the average return figures.
So, I reevaluated the same VIX signal, but I only allowed the model to “trip” once every 5 trading days:

Source: Bloomberg
This data looks better – in each case, the average return from buying a VIX signal is significantly higher than the average for the sample as a whole and fewer VIX signals fail, generating negative returns.
So, back to the original questions about the VIX I’ve been getting lately:
Is the VIX a useful indicator, how is it best used and is it signaling a bottom right now?
As is so often true in financial markets, the answer is complicated.
I have been monitoring and using the VIX and VXN for many years and I believe they’re useful indicators. However, a quick glance at my tables above reveals that the VIX is most useful as a short-term trading indicator rather than for calling a long-term low in the stock market.
Yes, history shows the VIX spikes near major market bottoms such as 2020 and 2009; however, the VIX also tends to spike multiple times early in a bear market. In the latter cases, the VIX often signals only an oversold “bounce” in the broader market rather than the beginning of a significant rally.
Indeed, I took a closer look at the success of VIX signals during bull markets. If we eliminate the four bear markets since 1990 -- the selloffs in 1991, 2000-02, 2007-09 and 2020 – the 20-day holding period return from VIX signals jumps from 1.454% to more than 1.90%.
As I noted before, buying the dip – buying fear in markets – tends to work best when the market is trending higher, so it’s hardly a shock that eliminating bear market signals improves performance.
Of course, eliminating bear market signals with the benefit of hindsight is a rather different matter than spotting a major top in the market in real time.
One more point: I tend to evaluate the VIX alongside other market indicators.
For example, if we get a spike in the VIX just as the S&P 500 tests a major support area, I’d consider that signal more meaningful. And, as I noted earlier, if the market is still locked in a powerful bull market, trading above its rising 100 and 200-day moving averages, VIX spikes tend to offer more meaningful signals.
Right now, the VIX and VXN are spiking, and the broader market has seen some impressive intraday reversals. However, breadth for the Nasdaq, in particular, continues to look weak – the Nasdaq’s Cumulative Advance-Decline is close to retesting its March 2020 (bear market) lows:
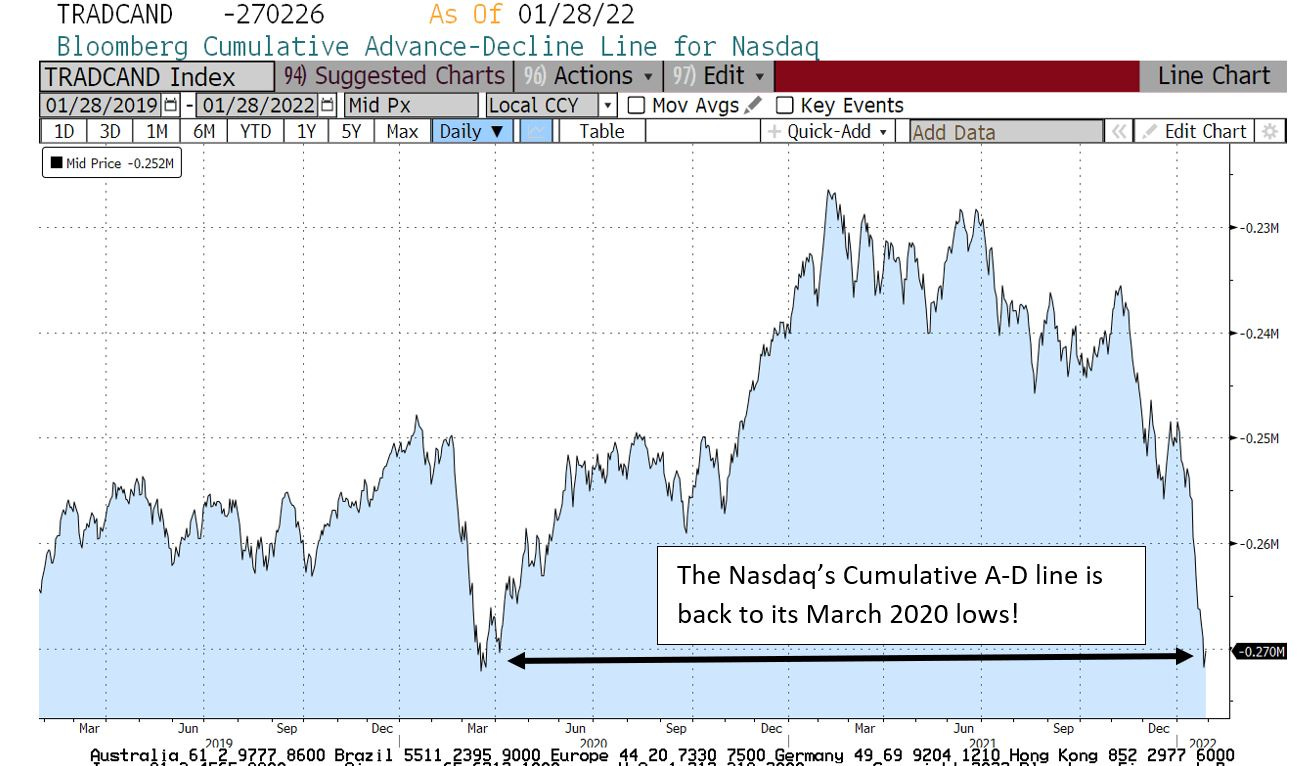
Source: Bloomberg
Bottom line: The recent VIX spike may generate a bit more market upside in the short term and a tradable bounce for more nimble traders.
However, there’s been sufficient deterioration in the market and economic indicators I follow to suggest any rally is more likely an oversold bounce rather than the beginning of a push to fresh all-time highs.
DISCLAIMER: This article is not investment advice and represents the opinions of its author, Elliott Gue. The Free Market Speculator is NOT a securities broker/dealer or an investment advisor. You are responsible for your own investment decisions. All information contained in our newsletters and posts should be independently verified with the companies mentioned, and readers should always conduct their own research and due diligence and consider obtaining professional advice before making any investment decision.