

What a Difference a Week Makes
What a Difference a Week Makes
Bond rally, recession and the year-end rally

Editor’s Note: It was great to meet so many Free Market Speculator readers at the Orlando Money Show this week.
I’ve received a number of requests from attendees for a copy of my presentation slide deck from my Sunday afternoon presentation titled “Finding Value in Energy,” so here it is for download in PDF format:
And, through tomorrow, November 3rd, I’m offering an extended 60-day free trial to the paid tier of Free Market Speculator to those interested, available only via this link:
As I outlined in my post on Tuesday, “Earnings and the Deteriorating Market Outlook,” the US stock market was in a precarious position at the end of last week with the S&P 500 crashing through its 200-day moving average amid a barrage of negative earnings news.
This week, of course, the market cheered the Treasury’s quarterly refunding statement, showing (slightly) reduced estimates for the government’s borrowing needs. Specifically, the consensus on Wall Street has been that the Treasury would need to issue around $846 billion in debt this quarter; however, the government’s actual statement projects $837 billion.
Granted, $9 billion is modest when we’re talking about numbers on this scale, so my (hopefully educated) guess is that the rally following this release represents a sigh of relief Treasury financing needs weren’t even higher.
In addition, all of the decline in planned bond sales relative to expectations was for longer-term Treasuries — a $3 billion drop in 10-year sales, $3 billion in 20s and $3 billion in 30-Year government bonds. That’s a positive because of the risk government borrowing eventually starts to impact the economy via falling reserves in the banking system:
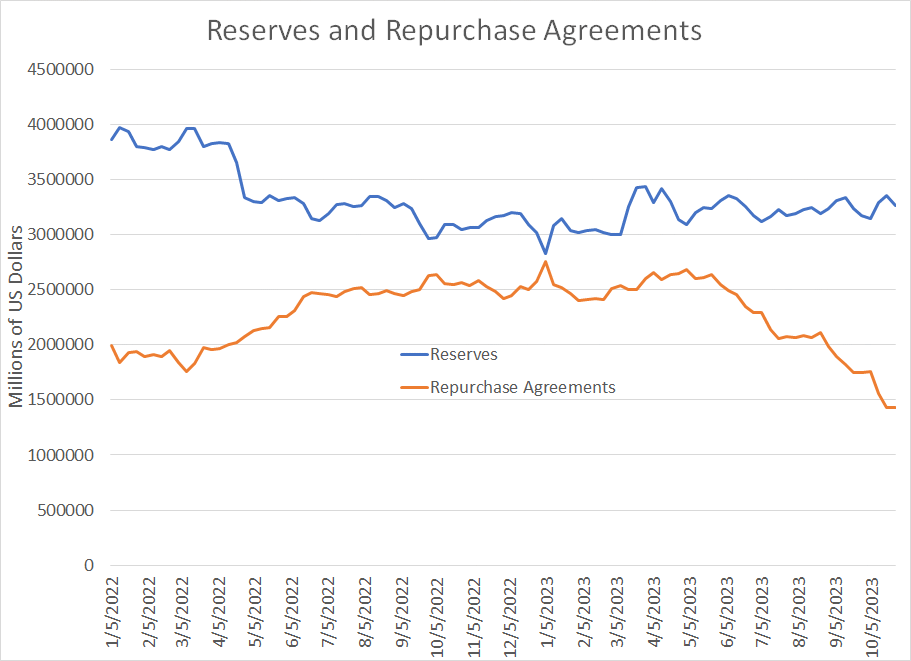
Source: Bloomberg, Federal Reserve
I’ve written about this issue on numerous occasions in FMS including “Treasury Yields, Banks and Credit.” Simply put, when the Treasury (US government) issues bonds to borrow money those funds have to come from somewhere — the two most likely sources are summarized in the chart above.
The Reverse Repo (RRP) facility at the Fed allows institutions to “park” money at the Fed on a short-term basis and earn a yield. Most of the cash in this facility comes from money market funds, which also have the option of buying short-term US Treasury debt such as 30-day T-Bills.
So, as you can see in my chart above, Reverse Repo balances at the Fed have declined from a peak of around $2.7 trillion this year to roughly $1.4 trillion today. The reason is yields in T-Bills have been higher than what’s available at RRP, so money market funds have simply removed money from the RRP to purchase T-Bills.
This sort of asset shuffling has little impact on economic activity — money market funds are simply funding the government’s deficits, chasing yields.
Bank reserves (the blue line) represent funds banks hold at the Fed. This “high powered money” is the lifeblood of the US economy, because reserves underpin banks’ ability to extend credit for everything from credit cards to commercial loans and residential mortgages.
Since money market funds can’t buy long-term debt — like 10-year and 30-year Treasury Bonds — when the government issues longer term bonds the most likely buyers are individuals or corporates. And when a person buys a Treasury bond, they’re likely to pay for that using money on deposit at US commercial banks. That, in turn, drains those reserve balances at the Fed.
Simply put, it’s clear Treasury is at least sensitive to this risk. That’s why they’ve responded by cutting planned issuance of longer term bonds to minimize the impact of government borrowing on bank reserve balances.
This remains a key fundamental to watch, especially as balances in the RRP shrink. Any sign that bank reserves are breaking down would signal an imminent tightening in US credit conditions.
In short, falling reserve balances would be a strong signal Fed tightening and QE are beginning to “bite” in a more sinister way.
As for the Fed, this chart sums up the shift in market expectations this week:

Source: Bloomberg
The chart above shows the implied Fed Funds Rate through January 2025 on two dates: Last Friday, October 27th (blue line) and today (orange line).
As you can see, not much of a shift here — towards the end of the period covered by this chart in late 2024, the market is now pricing in slightly higher probabilities for Fed cuts.
Regardless, both stock and bond markets have cheered this week’s events. For stocks, as I pointed out in Tuesday’s post, some of the rally this week is likely a function of just how oversold the market looked at the end of last week:
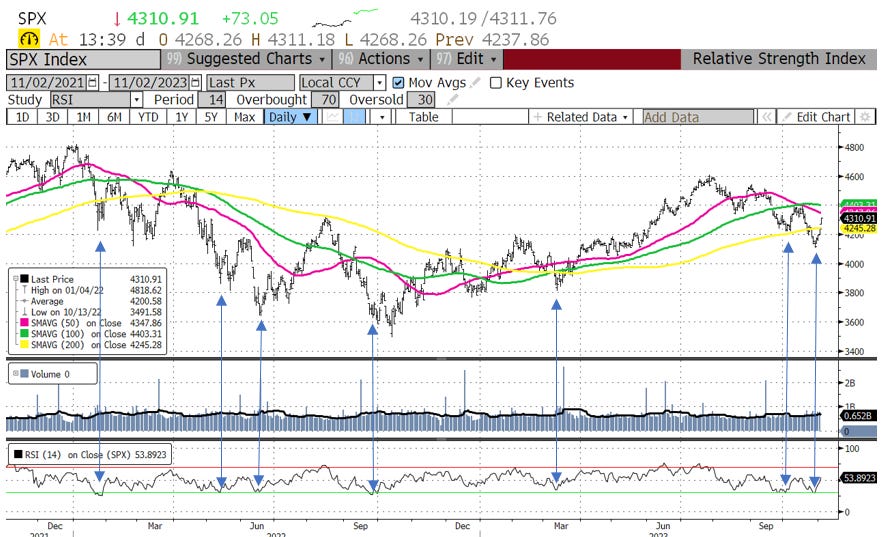
Source: Bloomberg
As you can see, when the Relative Strength Index (RSI) reaches an oversold reading of 30 or below on a closing basis, there’s a strong tendency for the market to rally, at least on a short-term basis. As I’ve indicated with arrows, such snap-back rallies have happened multiple times since early 2022 and it appears a similar move is underway right now.
This rally has also powered the S&P 500 back over its 200-day moving average:
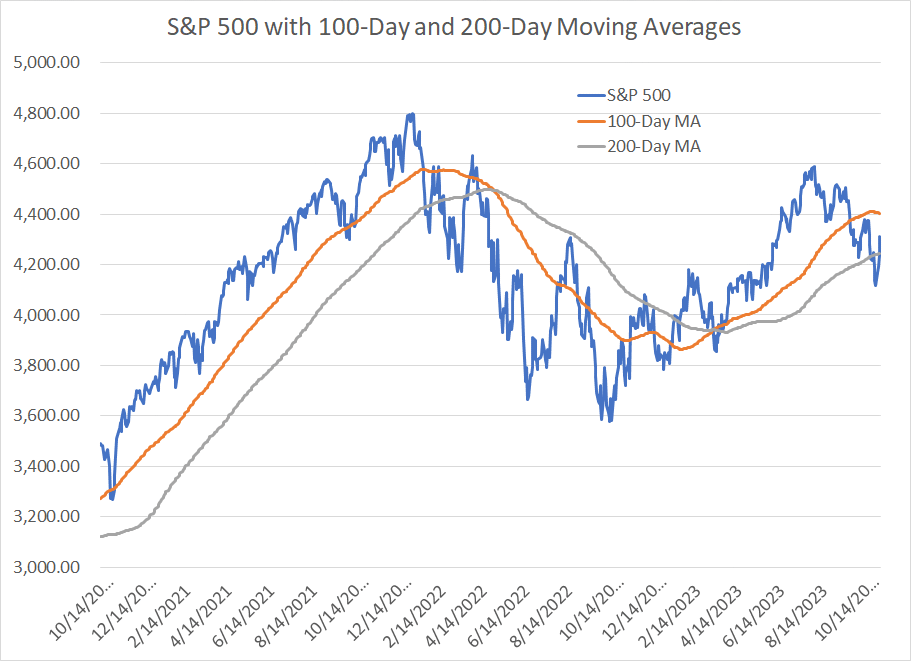
Source: Bloomberg
As I highlighted in “Market Breadth and Q4 Rallies,” short term breakdowns below the 200-day moving average are common during rallies and often represent buying opportunities. In addition, I’m always cautious about getting too bearish this time of year as there’s a powerful tendency for the stock market to rally in the final quarter of this year.
For now, the broader market appears to have held where it had to hold and it remains too early to get more aggressive in the model portfolio by adding inverse ETF exposure to hedge downside risk.
Short term trends aside, none of this changes the intermediate- to long-term picture. In my post earlier this week, I wrote about the negative earnings momentum we’ve seen this reporting season.
This week we also received further evidence of weaker economic momentum in the form of a far weaker-than-expected Institute for Supply Management (ISM) Manufacturing Survey:

Source: Bloomberg
The Manufacturing and New Orders indices stood at 46.7 and 45.5 respectively in the month of October; historically we’ve only seen readings this low immediately before and during US economic downturns (recessions).
This calls into question the entire “soft landing” narrative that’s become the Wall Street consensus, and the apparent consensus at the central bank, since mid-year.
Indeed, given the paltry shift in market expectations for Fed policy this week, I suspect the bond market rally may be more about a growing drumbeat of evidence the economy isn’t as strong as it might appear based on data like Gross Domestic Product (GDP).
As I pointed out in my piece on gold, “Gold’s Autumn Resilience,” gold prices have rallied to near $2,000/oz this fall despite rising real interest rates, soaring long-term rates and a strong US dollar. That’s characteristic of inflationary recession cycles such as we saw through the late 1960s and early 1970’s.
Right now, the market is cheering a potential top in long-term Treasury yields. However, in a typical cycle, equity optimism about the Fed quickly gives way to concerns about the economy, a plunging stock market and a flight-to-safety bid for Treasuries.
Looking into early 2024, my view remains the Fed’s next move is likely to be a CUT in rates, not further hikes, as a recession comes into view. That’s generally supportive for bond prices (lower yields), but it also likely means the bear market in the S&P 500 that started in early 2022 never really ended and the October 2022 lows won’t hold.
DISCLAIMER: This article is not investment advice and represents the opinions of its author, Elliott Gue. The Free Market Speculator is NOT a securities broker/dealer or an investment advisor. You are responsible for your own investment decisions. All information contained in our newsletters and posts should be independently verified with the companies mentioned, and readers should always conduct their own research and due diligence and consider obtaining professional advice before making any investment decision.